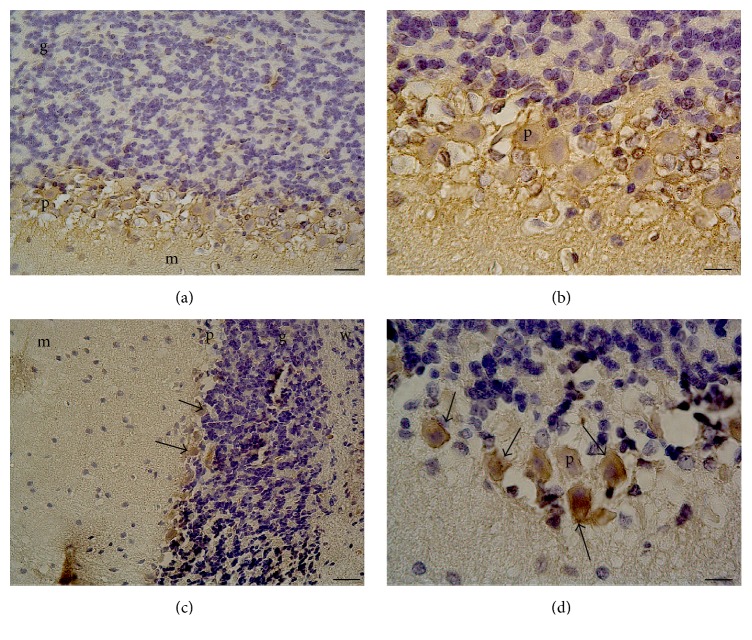
Figure 1.
α-Synuclein immunoexpression in Purkinje cells of normal and diabetic rats. (a and b) Control rats cerebellum Purkinje cells (×20 and 100 magnification, resp.). (c and d) Diabetic rats cerebellum Purkinje cells (×10 and 100 magnification, resp.). p: Purkinje cell; g: granule cell layer; m: molecular layer; w: white matter. The arrows indicate α-synuclein (+) cells.

