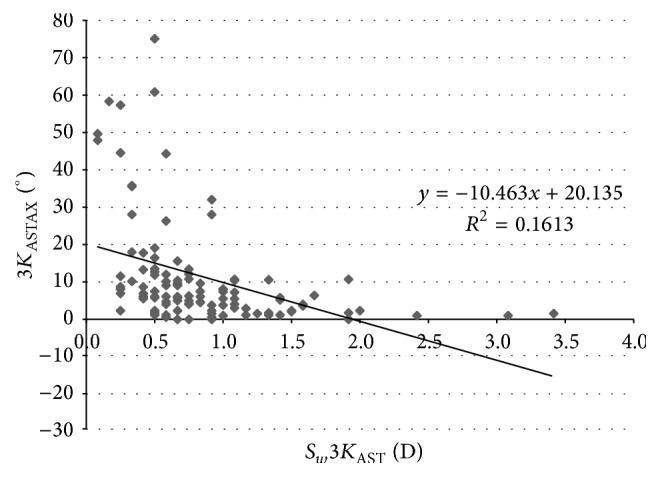
Figure 3.

Scatterplot showing the relationship among the mean magnitude of corneal astigmatism in the 3 mm central zone (3KAST) and the within-subject standard deviation (Sw) associated with the axis of such corneal astigmatism (3KASTAX). The adjusting line of data obtained by means of the least-squares fit is displayed.
