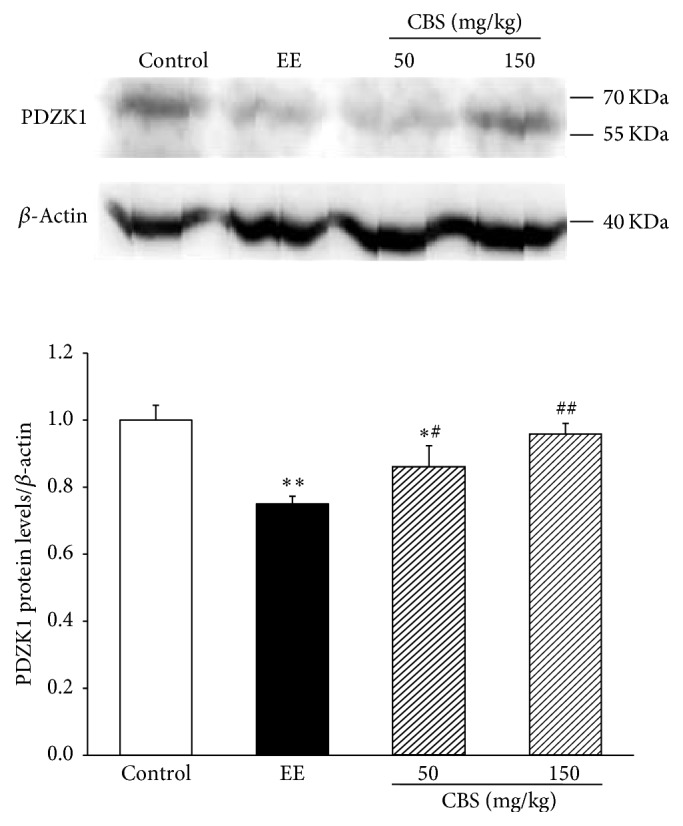
Figure 4.

Protein levels of PDZK1, measured by western blot and normalized to β-actin protein, relative to the control set as 1. Data are represented as mean ± SD of six rats per group. ∗P < 0.05, ∗∗P < 0.01 versus normal group; #P < 0.05, ##P < 0.01 versus EE group by one-way ANOVA and LSD post hoc test.
