
Fig. 6.
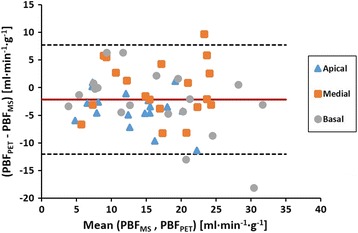
Assessment of agreement between PBFPET and PBFMS. Apical (triangle), medial (square), and basal (circle) regions are shown. The solid lines represent the mean bias (−2.19 ml min−1 g−1), and the dashed lines represent the 95% confidence interval (mean ± 1.96 SD)