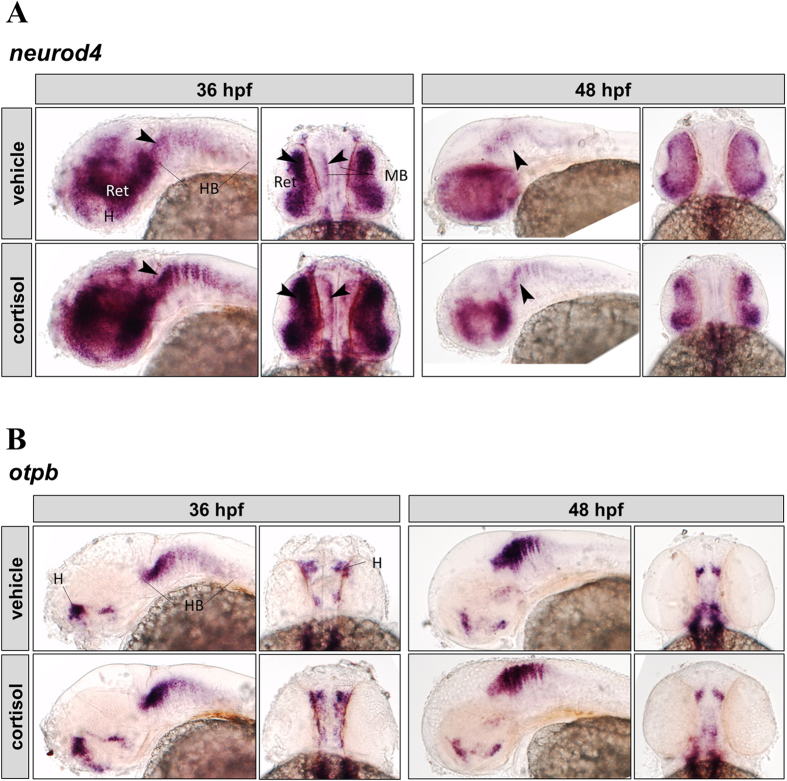
Figure 3. Cortisol effect on neurod4 and otpb expression in zebrafish embryos.
Whole-mount in situ hybridization of neurod4 (A) and otpb (B). Representative images (left, lateral view; right, dorsal view) are shown for each treatment (vehicle: top, cortisol: bottom) and time point (36 hpf: left, 48 hpf: right) on each panel. Regions indicated on vehicle controls (H, hypothalamus; Ret, retina; MB, midbrain; HB, hindbrain). Arrowheads indicate regions with differential expression; see text for details.

