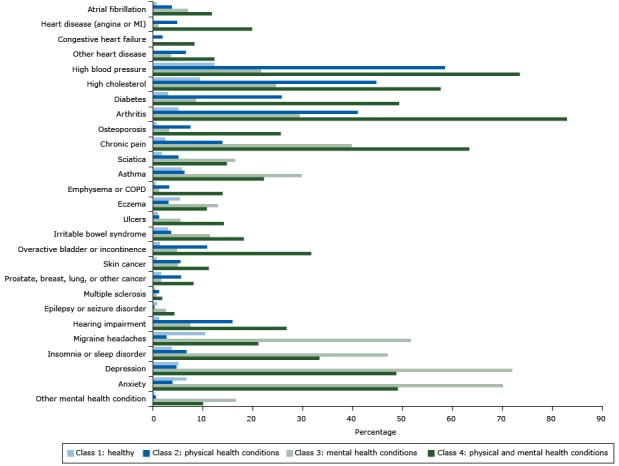
Figure.

Estimated probabilities of reporting diseases or conditions, by class (not adjusted for overall prevalence), in analysis of associations of behaviors and quality of life (n = 4,184), HealthStyles Survey, 2010. All probabilities were adjusted for age, race/ethnicity, sex, and yearly household income. Abbreviations: COPD, chronic obstructive pulmonary disease; MI, myocardial infarction.
| Chronic Condition | Class 1: Healthy | Class 2: Physical Health Conditions | Class 3: Mental Health Conditions | Class 4: Physical and Mental Health Conditions |
|---|---|---|---|---|
| Atrial fibrillation | 0.01 | 0.04 | 0.07 | 0.12 |
| Heart disease (angina or MI) | 0 | 0.05 | 0.01 | 0.20 |
| Congestive heart failure | 0 | 0.02 | 0 | 0.08 |
| Other heart disease | 0 | 0.06 | 0.04 | 0.12 |
| High blood pressure | 0.12 | 0.58 | 0.22 | 0.73 |
| High cholesterol | 0.09 | 0.45 | 0.25 | 0.58 |
| Diabetes | 0.03 | 0.26 | 0.08 | 0.49 |
| Arthritis | 0.05 | 0.41 | 0.29 | 0.83 |
| Osteoporosis | 0.01 | 0.07 | 0.03 | 0.26 |
| Chronic pain | 0.02 | 0.14 | 0.40 | 0.63 |
| Sciatica | 0.02 | 0.05 | 0.16 | 0.15 |
| Asthma | 0.06 | 0.06 | 0.30 | 0.22 |
| Emphysema/COPD | 0.01 | 0.03 | 0.01 | 0.14 |
| Eczema | 0.05 | 0.03 | 0.13 | 0.11 |
| Ulcers | 0.01 | 0.01 | 0.05 | 0.14 |
| Irritable bowel syndrome | 0.03 | 0.04 | 0.11 | 0.18 |
| Overactive bladder or incontinence | 0.01 | 0.11 | 0.05 | 0.32 |
| Skin cancer | 0.01 | 0.06 | 0.05 | 0.11 |
| Prostate, breast, lung, other cancer | 0.02 | 0.06 | 0.02 | 0.08 |
| Multiple sclerosis | 0 | 0.01 | 0.01 | 0.02 |
| Epilepsy or seizure disorder | 0.01 | 0 | 0.03 | 0.04 |
| Hearing impairment | 0.01 | 0.16 | 0.07 | 0.27 |
| Migraine headaches | 0.10 | 0.03 | 0.52 | 0.21 |
| Insomnia or sleep disorder | 0.04 | 0.07 | 0.47 | 0.33 |
| Depression | 0.05 | 0.05 | 0.72 | 0.49 |
| Anxiety | 0.07 | 0.04 | 0.70 | 0.49 |
| Other mental health condition | 0 | 0.01 | 0.16 | 0.10 |
