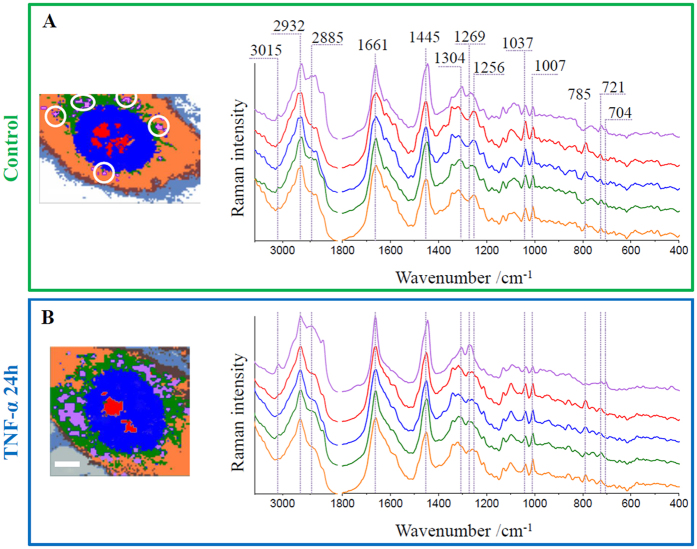
Figure 3. Representative cluster analysis images and average Raman spectra of main classes for control and TNF-α-stimulated HMEC-1 cells.
Cluster images of representative control (A) and stimulated with TNF-α (B) cells (7 classes: purple – lipid bodies, for control marked with white circles, red – nucleoli; blue – nucleus; green – endoplasmic reticulum; orange – cytoplasm, brown – cell membrane; gray – adhesion proteins) and the Raman average spectra of respective main classes. All spectra were maximally extended in the y-axis. Scale bars equal 6 μm.

