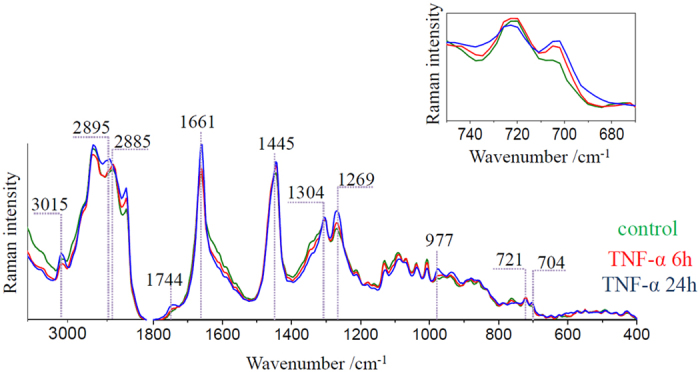
Figure 4. Comparison of Raman spectra of lipid bodies of control and TNF-α-stimulated HMEC-1 cells.

Raman spectra of lipid bodies extracted from control (green) and TNF-α-stimulated for 6 (red) and 24 hours (blue) HMEC-1 cells averaged over all measured cells. The insert shows changes in the intensity of the band at 704 cm−1. Spectra were normalized in the 1500–400 cm−1 spectral range.
