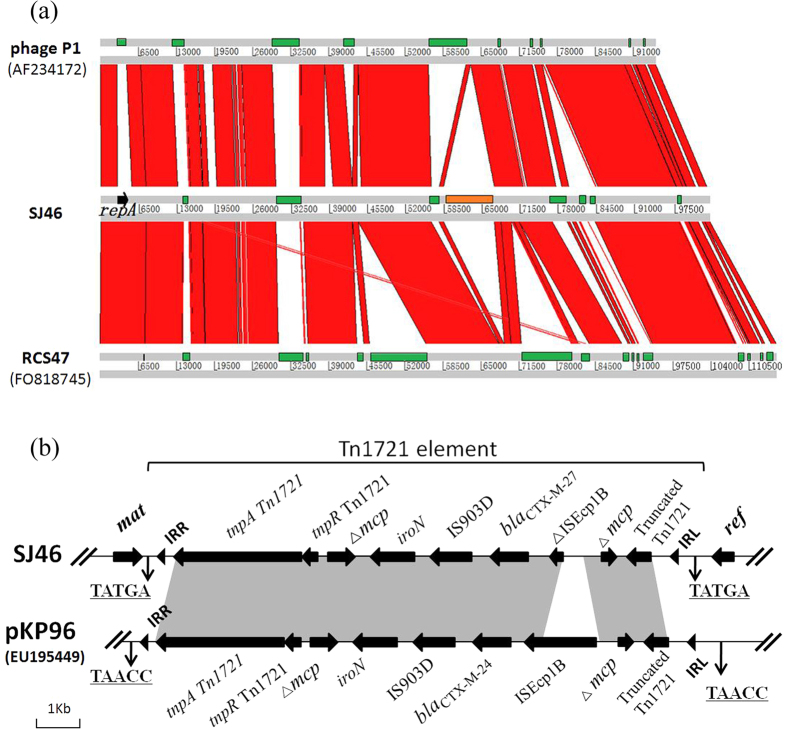
Figure 3.
(a) Sequence synteny comparisons between SJ46, bacteriophage P1 (AF234172), and bacteriophage RCS47 (FO818745) as determined with the Artemis comparison tool. The green rectangles are specific genomic regions. Strand conservations are showed in red and the inserted region is indicated in orange. (b) Gene environment representation of blaCTX-M-27 in SJ46 and gene structure comparison of the blaCTX-M-containing region of SJ46 and pKP96. Black arrows represent ORFs and their direction. IRs of the respective mobile elements are shown as black triangles. Nucleotide letters with underlining represent a direct duplication (DR).

