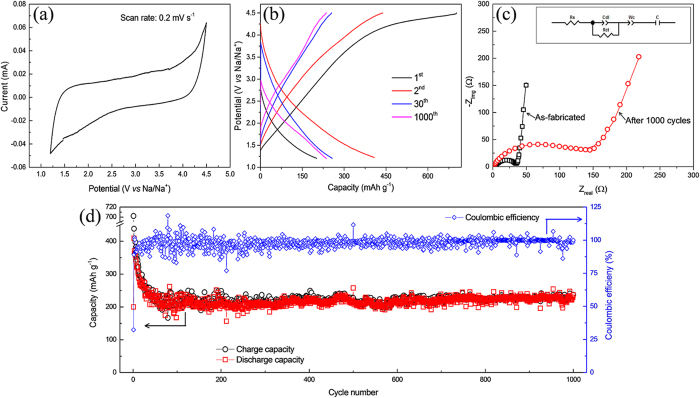
Figure 4. Evaluation of electrochemical performance of the RGO cathode.
(a) CV scan at a scan rate of 0.2 mV s−1 in a voltage range of 1.2–4.5 V. (b) Charge-discharge profiles at a current density of 30 mA g−1 in the 1st, 2nd, 30th, and 1000th cycles. (c) Electrochemical impedance spectroscopy analysis of as-fabricated and after 1000th cycles of RGO cathode and the inset shows the circuit diagram, used to calculate the charge-transfer resistance. (d) Cycle stability in a voltage range of 1.2–4.5 V at a current density of 30 mA g−1.

