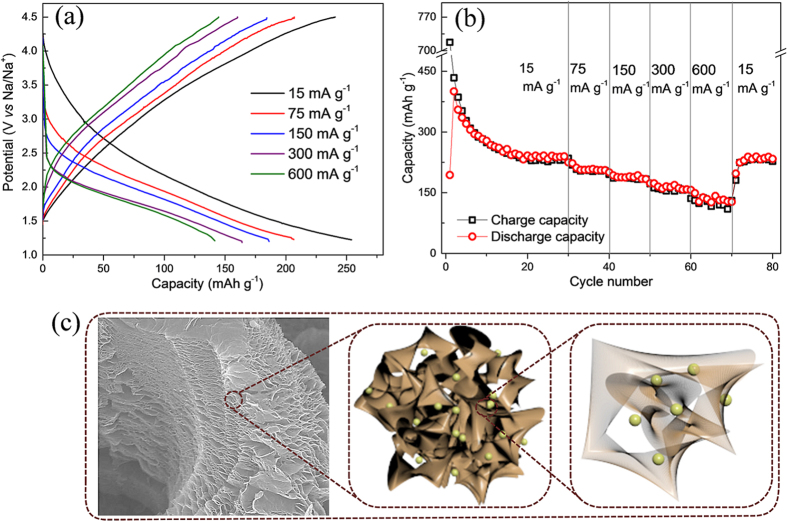
Figure 5. Galvanostatic rate performance and charge storage mechanism.
(a) Charge-discharge profiles at variant current densities and (b) the corresponding rate capabilities of RGO cathode at current densities of 15, 75, 150, 300 and 600 mA g−1. (c) Schematic representation of sodium de/insertion into the RGO nanosheets, where sodium atoms are represented in green.

