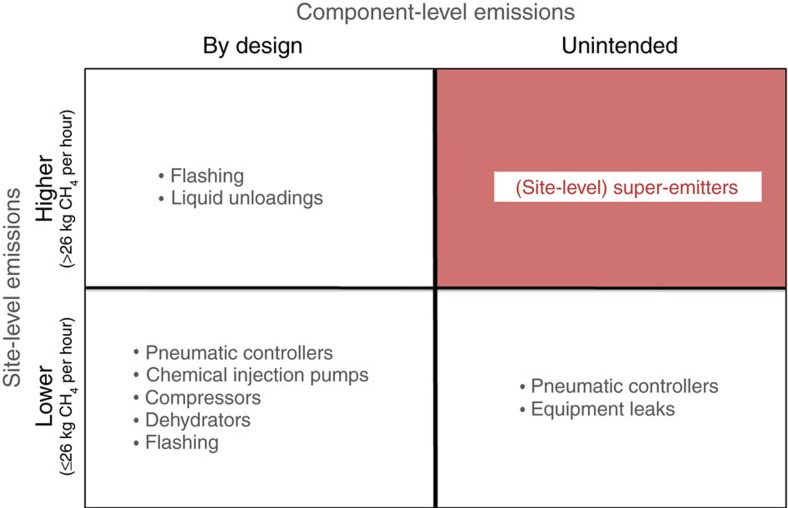
Figure 1. Classification of sites in terms of magnitude of emissions and component behaviour.
The vertical axis classifies sites in terms of magnitude of total site-level emissions (where 26 kg CH4 per hour is the threshold for higher emitters). The horizontal axis classifies sites in terms of component behaviour that results in emissions (emissions by design versus unintended). The bullets in each quadrant indicate the components that were included in our component-based aggregation model; these represent all known sources of emissions on natural gas production sites in the Barnett Shale. The shaded quadrant accounts for the existence of abnormal process conditions that result in high, unintended emissions, the defining characteristic of super-emitting sites.

