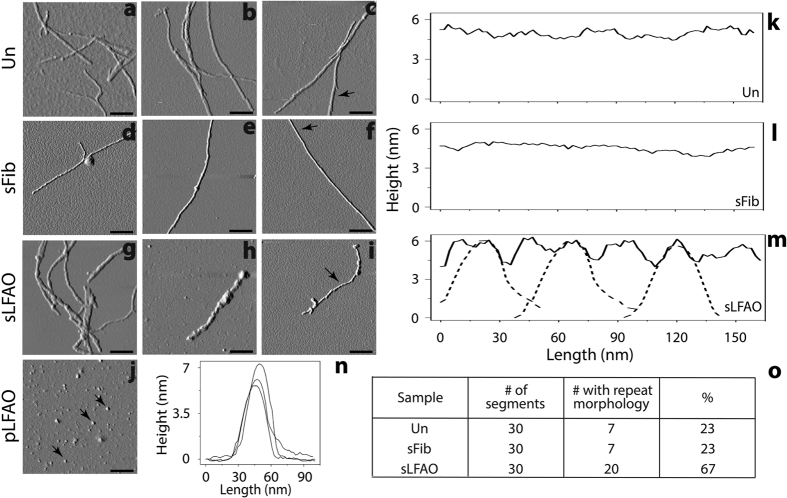
Figure 4. sLFAO fibrils reveal unique repeat morphology.
(a–j) AFM images of Un (a–c), sFib (d–f), and sLFAO (g–i) aggregates at 10 days of incubation, along with pLFAOs (j). Scale bars represent 200 nm. (k–n) Surface morphology analysis of Un (k), sFib (l), sLFAO (m, solid), and pLFAOs (n), as indicated by black arrows. The dashed lines in panel m represent data from pLFAOs in panel n. (o) Statistical analysis of AFM images, as described in the text.

