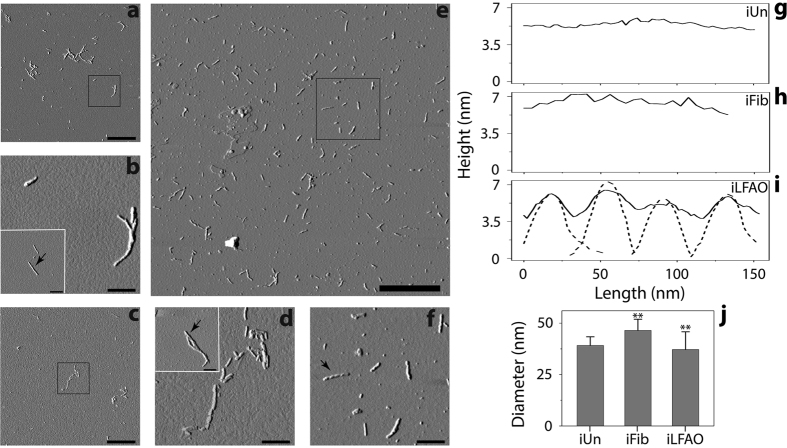
Figure 6. Unique repeat morphology is retained within iLFAOs.
(a–f) AFM images of sonicated and isolated (fraction 18) Un (iUn, a,b), sFib (iFib, c,d), and sLFAO (iLFAO, e,f). Inset) AFM images used for surface analysis. Scale bars for (a,c and e) represent 1 μm, while (b,d,f) and insets represent 200 nm. (g–i) Surface morphology analysis, as indicated by black arrows. The dashed line in panel i represents pLFAO analysis (Fig. 2n). (j) Dynamic light scattering of fractions 18 of iUn, iFib, and iLFAO samples. **represents p < 0.05.

