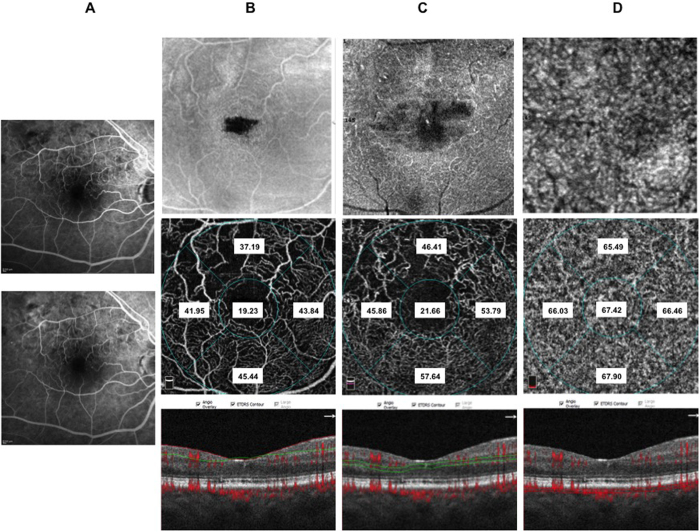
Figure 6. Fluorescein angiography (FA), enface optical coherence tomography (OCT) and OCT angiography (OCTA) images of the same patient after IVDEX implant.
Early (panel A: top) FA and late FA (panel A: bottom) reduction of retinal hemorrhages and mild vascular leakage in the late phase. Enface OCT images at the level of the superficial retinal plexus (panel B: top) with almost complete recovery of retinal structure. Corresponding OCTA frame at the level of superficial retinal plexus (panel B: middle) showing rarified vessels in the superior macular area with disruption of perifoveal anastomotic arcade. Enface OCT at the level of the deep retinal plexus (panel C: top) showing partial recovery of retinal structure. Corresponding OCTA frame at the level of the deep plexus (panel C: middle) showing almost normalized vessel caliber that are rarified mainly in the supero-temporal sectors. Enface OCT at the level of the choriocapillary (panel D: top) showing normal texture. Corresponding OCTA frame at the level of choriocapillaris (panel D: middle) showing normal choriocapillaris texture due to resolution of the overlying hemorrhages and intraretinal edema. OCTA images with vessel densities and relative longitudinal B-Scan images with highlighted layer segmentation (panel B, C, D: bottom left, bottom middle, bottom right).

