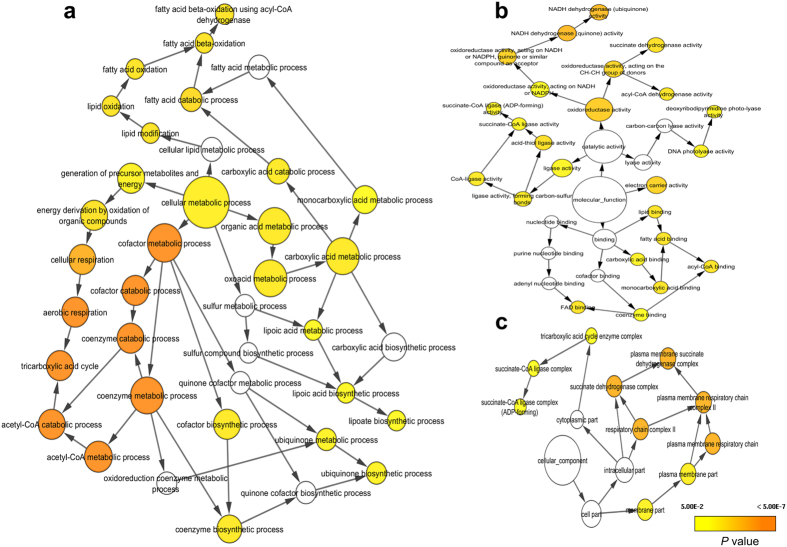
Figure 1. Gene Ontology (GO) term network analysis of all differentially expressed genes (Set1 DEGs).
Functional enrichment analysis was performed for all DEGs with the BINGO plug-in in Cytoscape. Assigned GO terms were used to classify functions of DEGs based on (a) biological processes, (b) molecular functions, and (c) cellular components. The yellow and orange nodes represent terms with significant enrichment, with darker orange representing a higher degree of significance, as shown by the legend on graph. White nodes are terms with no significant enrichment, but are included because they have a significant child term.

