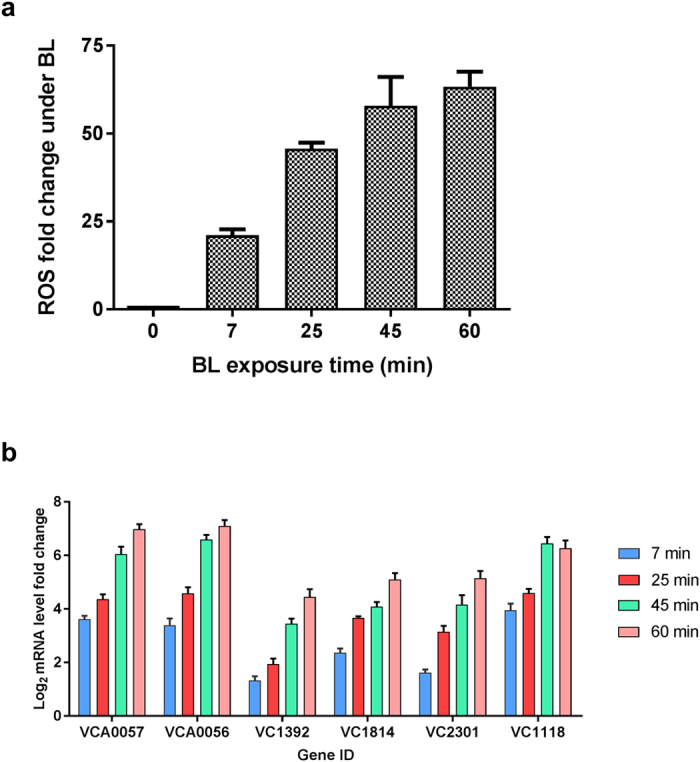
Figure 3. Time-dependent reactive oxygen species (ROS) accumulation and qRT-PCR measurement after blue light (BL) exposure.

(a) Samples were taken at 7, 25, 45, and 60 min after BL exposure and total ROS amount were measured using 2′,7′-dichlorofluorescin diacetate (DCF-DA). Fold change was calculated between dark- and BL-treated samples at indicated times. (b) qRT-PCR measurement of transcription level of several genes selected from Set1 DEGs with respect to BL exposure time. Each colored bars with standard errors represent relative mRNA levels of genes at indicated BL exposure time with respect to dark conditions (log2 fold) determined from three independent biological replicates (n = 6).
