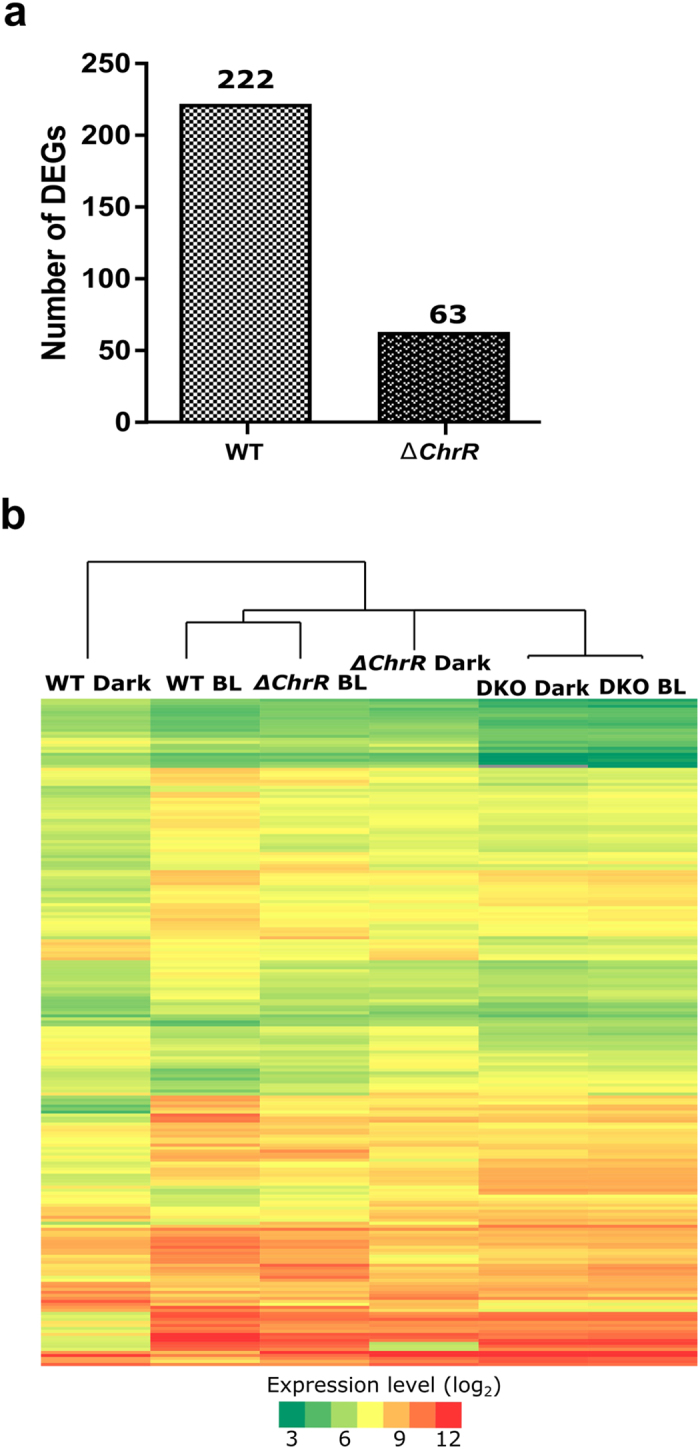
Figure 4. Differentially expressed genes (DEGs) in wild-type (WT), ΔChrR, and ΔChrRΔMerR knockout (DKO) cells under dark and blue-light conditions.

(a) Pairwise comparison of number of DEGs in WT andΔChrR cells. (b) Heat maps of the ΔChrR and DKO cells were constructed based on Set1 genes (DEGs in WT). Expression levels are represented by color: green, lowest expression level; yellow, moderate expression level; red, highest expression level. Extreme values in color gradient are 3 to 12 in log2 scale.
