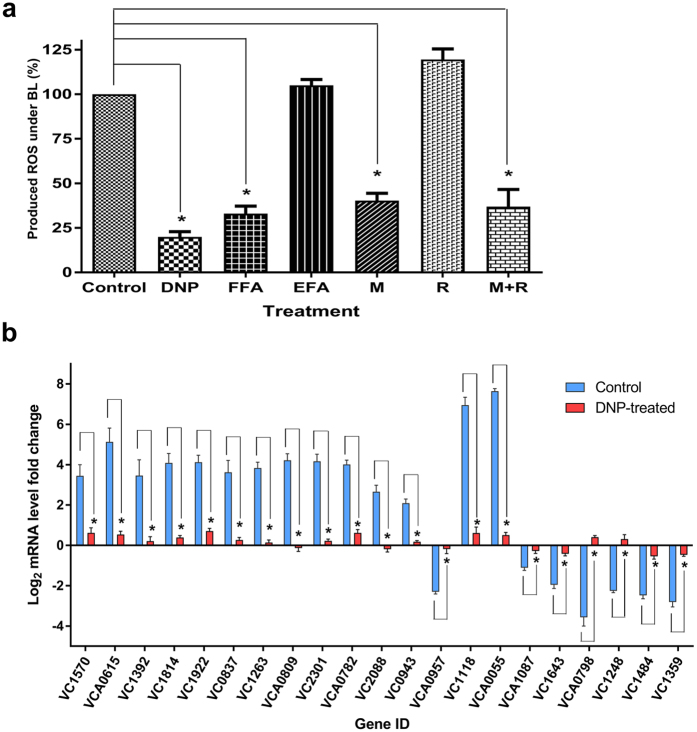
Figure 6. Reactive oxygen species (ROS) accumulation under blue light (BL) after chemical treatments and expression analysis of 2,4-dinitrophenol (DNP)-treated wild-type cells.
(a) Wild-type cells were treated with 20 mM malonate (M), 100 μM rotenone (R), 500 μM DNP, 50 μM FFA, and 50 μM etofenamate (EFA, a derivative of FFA) for 60 min in darkness, then cells were exposed to BL (50 μmoles m−2s−1) for 45 min. Fold change was calculated between dark- and BL- treated samples, and then percentage change for each treatment was calculated after setting amount of ROS in wild-type cells at 100%. Error bar: SD; n = 6, *p < 0.05, Student’s t-test. (b) Transcript levels of selected DEGs were quantified by qRT-PCR after wild-type cells were treated with DNP and exposed to BL. Blue (non-treated wild-type cells) and red (DNP-treated wild-type cells) bars with standard errors represent relative mRNA expression levels with respect to dark conditions (log2 fold) determined by qRT-PCR from three independent biological replicates. n = 6, *p < 0.05, Student’s t-test.

