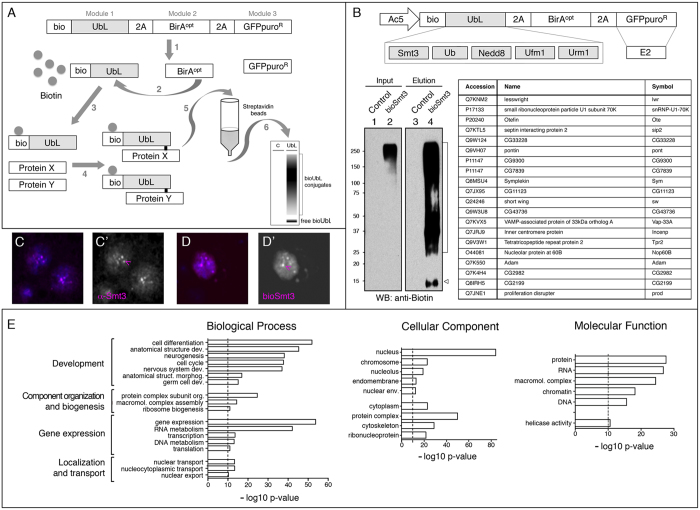
Figure 1. Isolation and identification of bioSmt3 conjugates in Drosophila cultured cells.
(A) Schematic representation of the bioUbL strategy. See text for details. (B) Up: schematic representation of the bioUbL vectors for Drosophila cells. Left: the blot shows the enrichment in bioSmt3 conjugates in the elution panel using anti-biotin antibodies (lane 4; bracket). Arrowhead indicates free bioSmt3 in lane 4. Right: top twenty bioSmt3-modified proteins based on raw intensity. (C,D) bioSmt3 (pAc510x-bioSmt3-Lwr) visualized with fluorescently labeled streptavidin (D) localizes in a similar way than the endogenous Smt3 in S2R+ cells (C). Nuclei were marked with DAPI (blue). Green and red channels are shown independently in black and white (C’, D’). (E) GO analysis for biological process, cellular component and molecular function of the selected bioSmt3-conjugated protein set (n = 1054).

