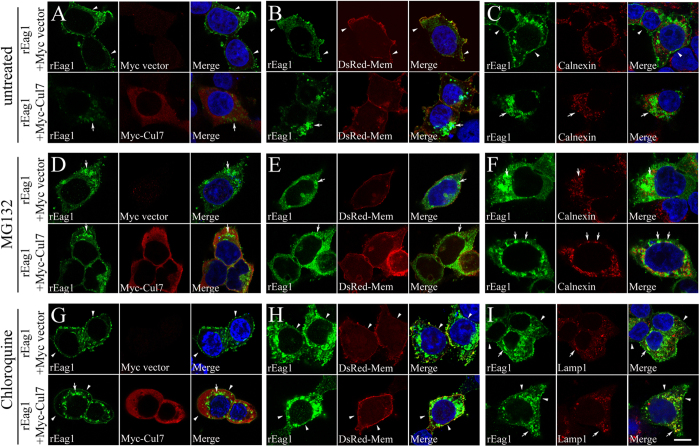
Figure 7. Pharmacological suppression of proteasomal and lysosomal degradations alters subcellular localization of rEag1 in HEK293T cells.
Representative confocal micrographs showing rEag1 immunofluorescence signals (green) in response to Cul7 co-expression (A,B,C), or 6-hour MG132 (D,E,F) or chloroquine (G,H,I) treatment. rEag1 and Myc-Cul7 were detected with anti-rEag1 and anti-Myc antibodies, respectively. Nuclei were counterstained with DAPI (blue). To verify plasma membrane localization, some cells were co-transfected with the DsRed-membrane expression vector (DsRed-Mem). ER and lysosomal localizations were detected by specific antibodies for the ER marker calnexin and the lysosome marker lamp1, respectively. Merge images are shown in the third column of each panel. Arrowheads indicate plasma membrane staining, whereas arrows denote intracellular staining. See Supplementary Methods and Supplementary Figure S2B for further quantitative analyses. Scale bar, 10 μm. Data shown here are representative of over 80 cells from at least 3 independent experiments.

