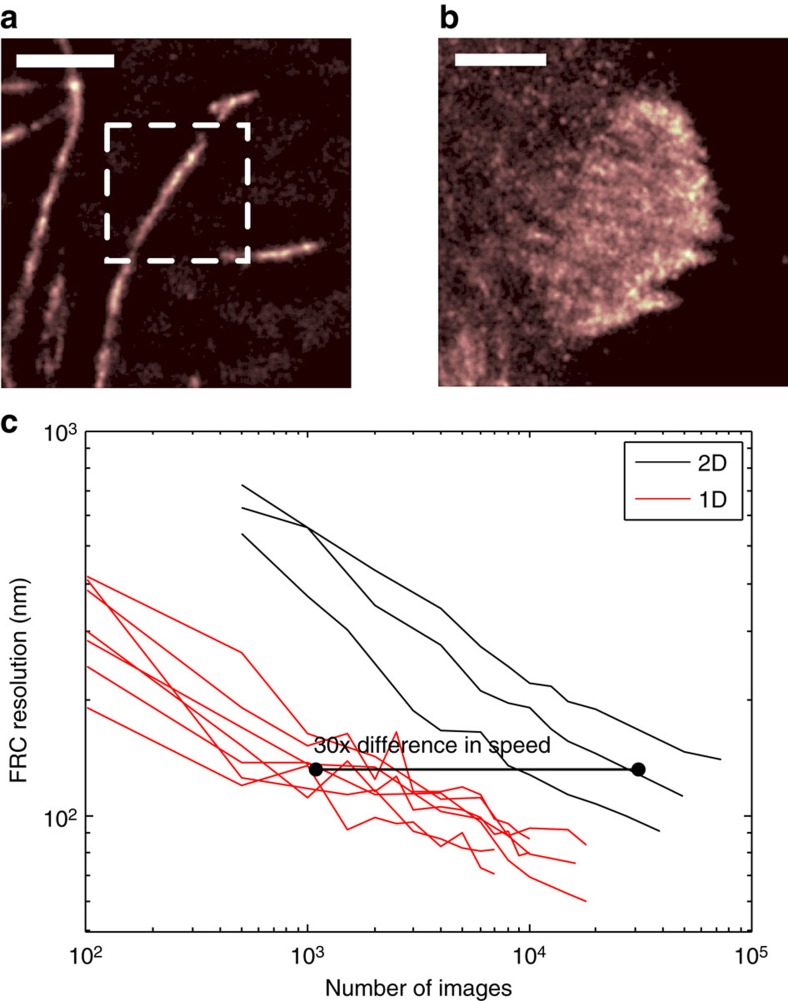
Figure 2. Variation of imaging speed with local sample dimensionality in live cells.
Microtubules were used as 1D structure and vinculin in focal adhesions was used as a 2D structure. Reconstructed super-resolution images of the microtubule and focal adhesion samples are shown in a and b, respectively. The dotted box in a shows a representative sampled area and the whole of b is a representative sampled area. Areas of different sizes were used to allow selection of areas containing only 1D or 2D structure, and to minimize cutting across the structure to obtain the sample area, which alters the resolution reported by FRC. Scale bar, 1.75 μm in both images. The values of  indicate an expected factor of 38 times difference in achievable acquisition speed. (c) The FRC resolution value against the number of time frames included in the sequence. Different lines correspond to image sequences of different areas. The observed difference in FRC shows an approximately × 30 difference in resolution. The activation densities were calculated to be ≈0.18 and ≈1.5 activations μm−2 for the microtubule and focal adhesion experiments, respectively.

