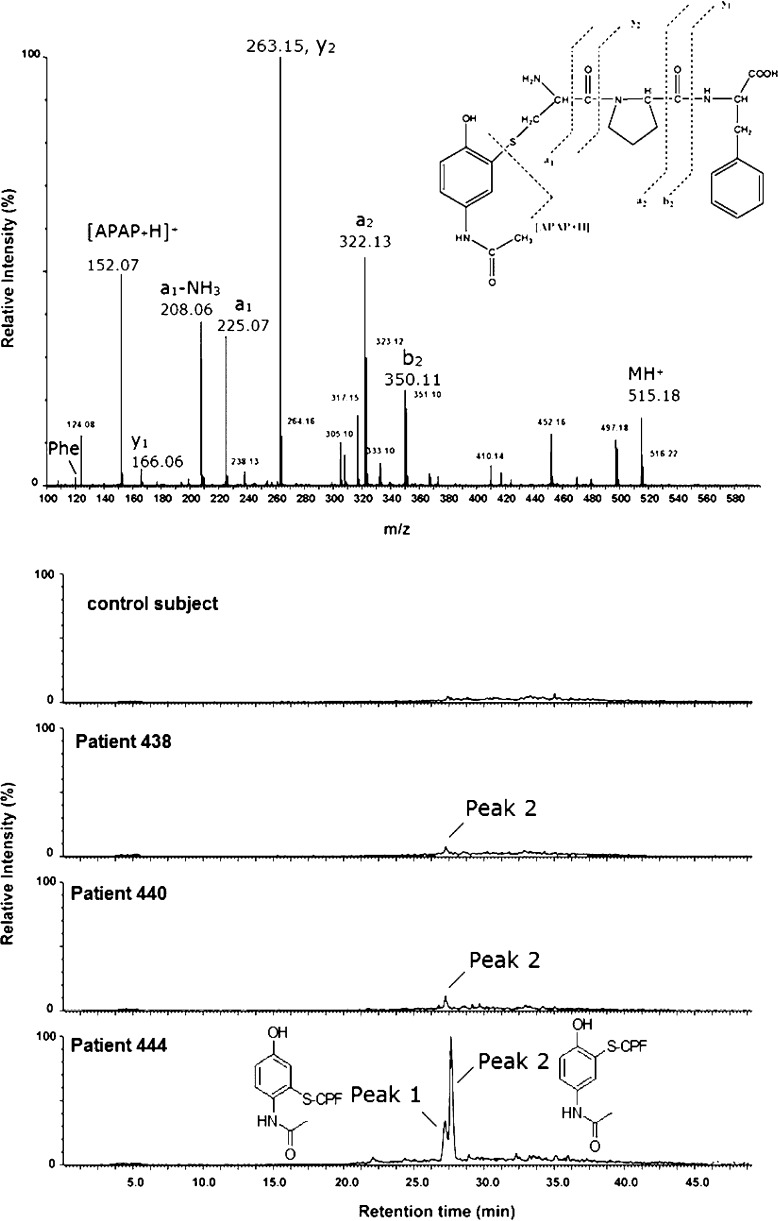
Figure 16.
LC-MS/MS analysis of NAPQI-CPF adducts in human serum samples (MH+ at m/z 515.2) obtained after the pronase digest. Ion chromatograms of summed ions: m/z 152.1, 208.1, 225.1, 322.2, 323.2, and 351.2 in the control subject, patient 438, patient 440, and patient 444. The analyses of the 23-, 4-, and 25-h time point samples of patients 438, 440, and 444, respectively, are shown. The upper panel shows the product ion spectrum of the NAPQI-CPF adduct obtained from the reaction of synthetic NAPQI with synthetic tripeptide CPF. The product ion spectra of the NAPQI-CPF adducts corresponding to regioisomers of NAPQI-CPF (peak 1 and peak 2) in patient 444 are shown. Adapted with permission from ref (116). Copyright 2007 American Society for Pharmacology and Experimental Therapeutics.

