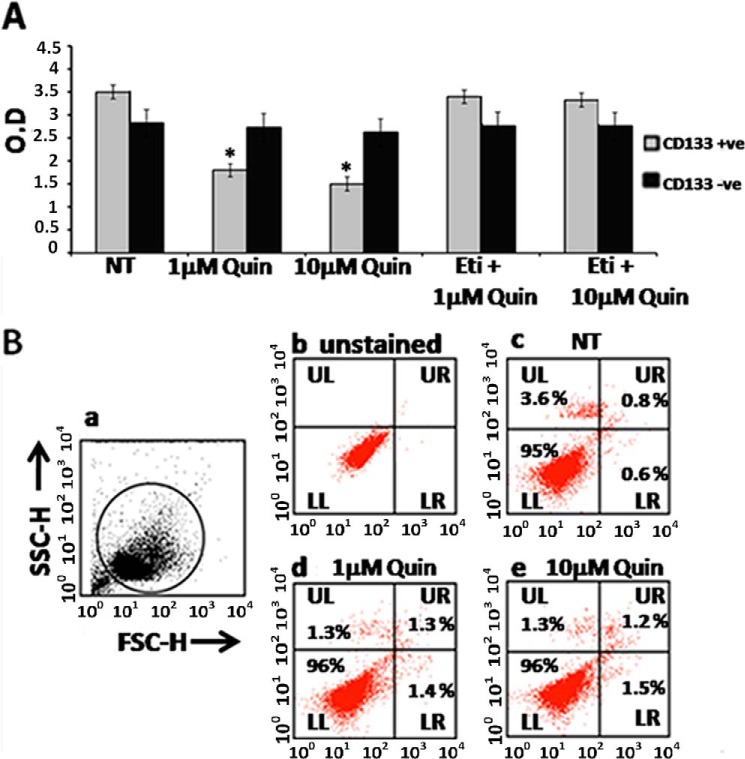
FIGURE 3.
Effects of D2 DA receptor stimulation by D2 dopamine agonist quinpirole on proliferation (A) and apoptosis (B) of CD133+ve tumor cells purified (>95%) from A549 NSCLC cell line. A, proliferation measured by the MTT assay following treatment of CD133+ve and CD133−ve tumor cells with 1 or 10 μm quinpirole (Quin) in the presence or absence of eticlopride (Eti), the D2 receptor-specific antagonist (10 times more the concentration of D2 receptor-specific agonist, quinpirole) for 72 h. Results are representative of 3 independent experiments. *, p ≤ 0.05 no treatment (NT) versus 1 μm and no treatment versus 10 μm, O. D., optical density. B, apoptosis was measured by the annexin V-PI staining assay following treatment of CD133+ve tumor cells with 1 or 10 μm quinpirole. Panel a, forward scatter/side scatter (FSC/SSC) plots show the gated population. H indicates height. Panel b, unstained. Panel c, no treatment. Panel d, 1 μm quinpirole. Panel e, 10 μm quinpirole. Lower left (LL), annexin V-PI− (viable cells); lower right (LR), annexin V+PI− (early apoptotic cells); upper left (UL) annexin V-PI+; upper right (UR), annexin V+PI+ (late apoptotic cells). Results are representative of 3 independent experiments. Error bars indicate mean ± S.D.

