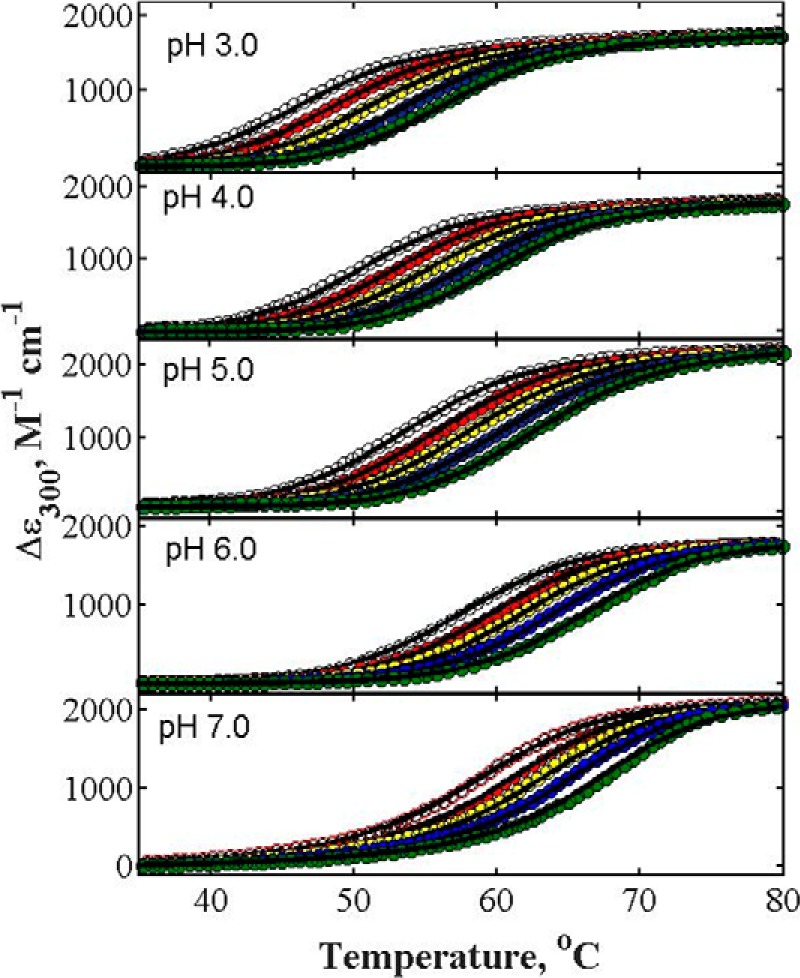
FIGURE 3.

Representative curves of thermal denaturations of lysozyme in the absence and presence of different concentrations of glucose at different pH values. Data sets in each panel from left to right represent increasing concentrations of glucose, 0.0, 0.50, 1.00, 1.50, and 2.00 m. Solid curves are plotted according to Equations 3–8 of Beg et al. (see Ref. 18) using the best-fit value of α for glucose plotted in Fig. 4. Although all denaturation curves were measured in the temperature range of 20–85 °C, for the sake of clarity plots cover a reduced temperature range. Thermal denaturation of lysozyme was carried out in the presence of 2 m GdmCl, as described under “Experimental Procedures.”
