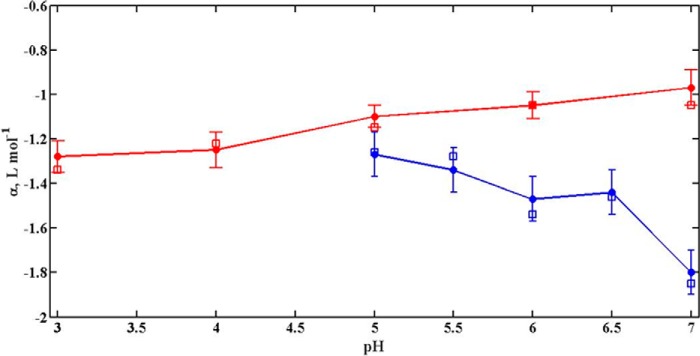
FIGURE 4.
Plot of pH-dependence of α, estimated by using different methods, for α-LA (blue) and lysozyme (red) in the presence of glucose. Values of α estimated by using the rapid approximate method are represented by open square (□), and by excluded volume model are represented by closed circle (●) with standard error for both proteins.

