FIGURE 7.
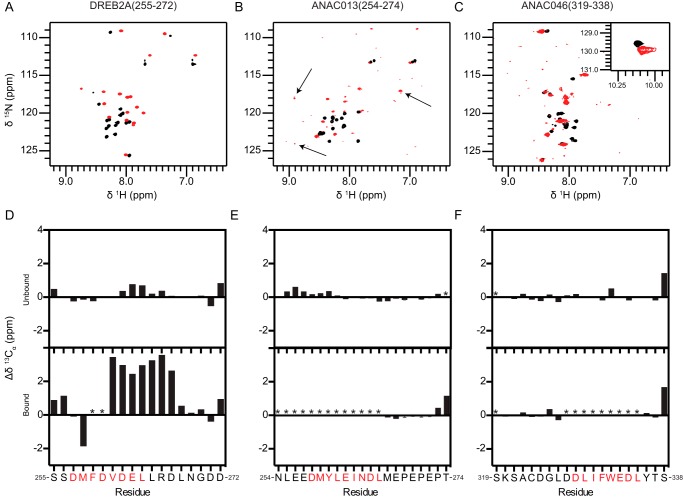
Secondary structure analyzed by NMR spectroscopy. 1H,15N HSQC spectra of 13C,15N-labeled DREB2A(255–272) (A), ANAC013(254–274) (B), and ANAC046(319–338) (C) in the free state (black spectra) and in complex with unlabeled RCD1-RST(499–572) (red spectra). Weak peaks with large changes in chemical shifts in the ANAC013(254–274) spectra are indicated with arrows. Secondary Cα chemical shifts for DREB2A(255–272) (D), ANAC013(254–274) (E), and ANAC046(319–338) (F) in the free state (top figures) and in complex with unlabeled RCD1-RST(499–572) (bottom figures). Consecutive positive and negative values indicate α-helical and β-sheet/extended structures, respectively, whereas values close to zero indicate coil-like structures. SLiM residues are indicated with red letters. Because of the degeneracy of the sequence resulting in almost identical chemical shifts for residues Glu-267–Glu-270 in ANAC013, the glutamate and proline residues were each assigned an average value. Error bars indicate the largest and smallest possible values for each residue.

