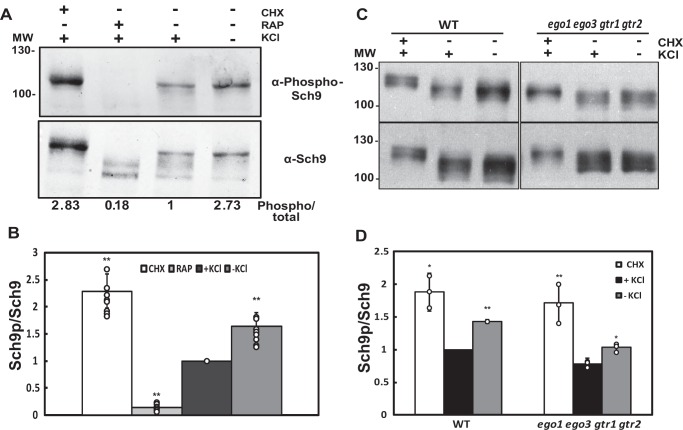
FIGURE 5.
Levels of Sch9 phosphorylation increased in response to limiting potassium conditions. A, BY4741 cells were grown in Translucent medium supplemented with 50 mm KCl. Cells were treated with rapamycin (RAP) (200 ng/ml) or cycloheximide (CHX) (25 μg/ml) or incubated for 30 min without potassium and further analyzed for Sch9 phosphorylation by immunodetection employing the phospho-specific Sch9S758 and pan-Sch9 antibodies. B, quantification of Sch9 phosphorylation levels from experiments performed as in panel A were normalized using Sch9 total protein, and the results are expressed as relative phosphorylation of Sch9 considering WT cells grown in potassium-supplemented Translucent medium (+KCl) as the reference value. Results correspond to the mean values ± S.D. of independent clones. Sch9p = phosphorylated Sch9. Similar results were also observed in the W303-1A background. C, TB50a control (WT) and ego1 ego3 gtr1 gtr2 strains were analyzed as described in A. A representative experiment is shown. D, quantification of Sch9 phosphorylation levels was performed as in B. The bars represent the average value for the independent experiments, the circles represent each individual data point, and the error bars show the S.D. Asterisks (*) indicate statistical significance (t test) with a p value < 0.05. Double asterisks (**) indicates statistical significance with a p value < 0.01.

