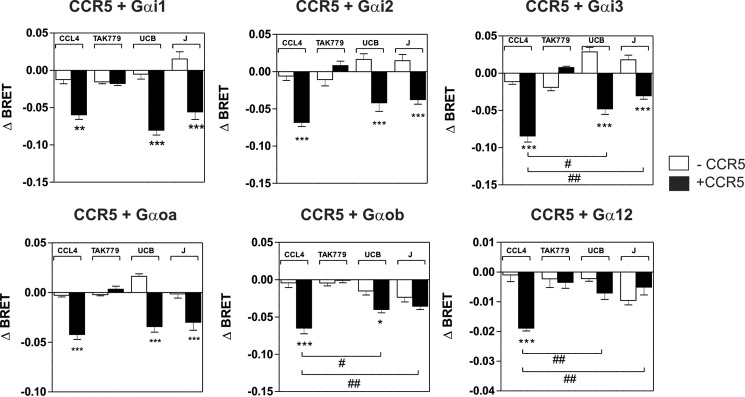
FIGURE 4.
Panel of G proteins activated by CCR5 upon stimulation by CCL4, J113863, or UCB35625. Real-time measurement of BRET signal in HEK293T cells coexpressing CCR5 and G protein biosensors (black bars) or G protein biosensors only (open bars) and stimulated for 1 min with 100 nm of CCL4, 1 μm TAK779, 100 μm UCB35625 (UCB), or 100 μm J113863 (J). Results are expressed as the difference in BRET signal measured in the presence and absence of stimulation. Data represent the mean values ± S.E. of six independent experiments. Statistical significance between cells expressing or not CCR2 (***, p < 0.001; **, p < 0.01; *, p < 0.1) and between ligands (##, p < 0.01; #, p < 0.1) was assessed using Tukey's test.

