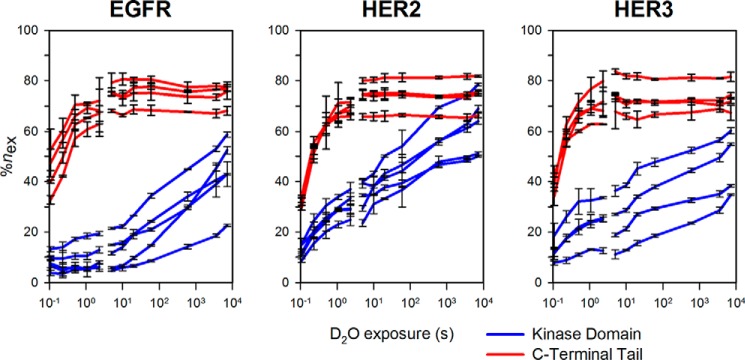
FIGURE 2.
Example HDX-MS uptake curves for EGFR, HER2, and HER3. Selected peptides from the kinase domains or C-terminal tail of each protein are shown in blue and red, respectively. Deuterium uptake reaches a plateau more quickly for the C-terminal tail as compared with the kinase domain. %nex is calculated as the percentage of exchange relative to the maximum number of exchangeable amide hydrogens in each peptide normalized by the H2O:D2O labeling ratio used in both labeling time course sets of experiments. Each data point represents the mean %nex value determined from triplicate measurements with error bars representing the S.D. at each point.

