FIGURE 6.
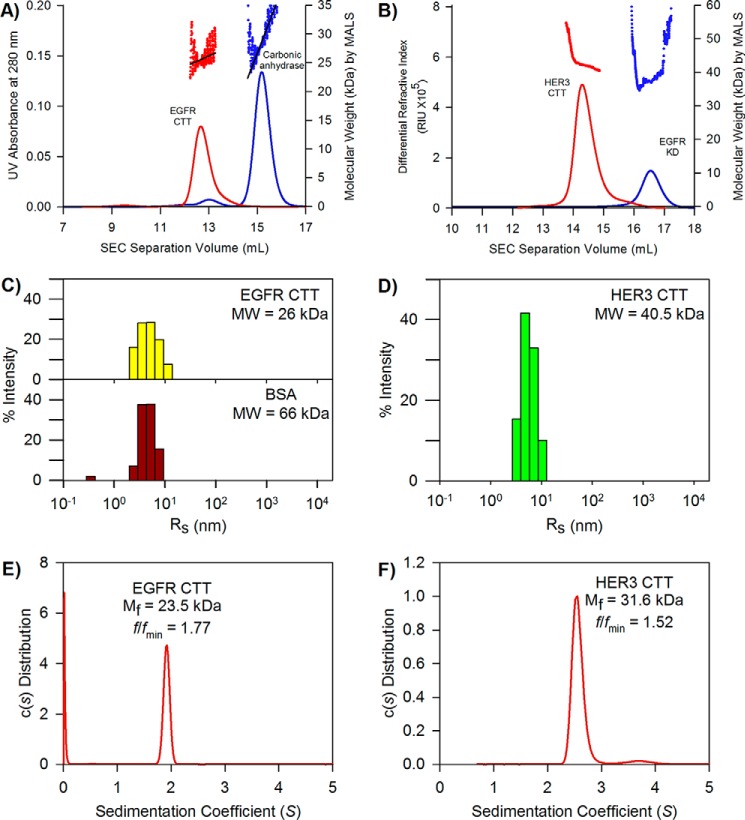
Hydrodynamic properties of EGFR and HER3 CTT. A, elution chromatograms and molecule weight determination of EGFR CTT by SEC-MALS. EGFR CTT data are shown in red, and carbonic anhydrase data are shown in blue. Despite similar molecular weights, EGFR CTT elutes sooner, indicating a larger hydrodynamic size. B, SEC-MALS analysis of HER3 CTT. HER3 CTT data are shown in red, and EGFR kinase domain data are shown in blue. Again, the two molecules share similar molecular weights, but HER3 CTT elutes sooner than the EGFR KD. C, hydrodynamic radius determination of the EGFR CTT and BSA by dynamic light scattering. The measured DLS hydrodynamic radius distribution for EGFR CTT is shown as yellow bars. The measured hydrodynamic radius of EGFR CTT is 5.3 nm. The histogram for BSA (monomeric fraction obtained by gel filtration) is shown as red bars. The Rh of monomeric BSA is 4.8 nm. D, hydrodynamic radius determination of the HER3 CTT. The measured DLS hydrodynamic radius for HER3 CTT is 6.4 nm. E, frictional coefficient, frictional ratio, and molecular weight determined by analytical ultracentrifugation. The sedimentation coefficient was used to measure an apparent molecular mass, Mf, of 23.5 kDa. The frictional ratio for the EGFR CTT is 1.77, indicating a large Stokes radius relative to globular proteins. F, frictional coefficient, frictional ratio, and molecular weight determined by analytical ultracentrifugation. The measured apparent molecular mass of HER3CTT is 31.6 kDa. The frictional ratio is 1.52.

