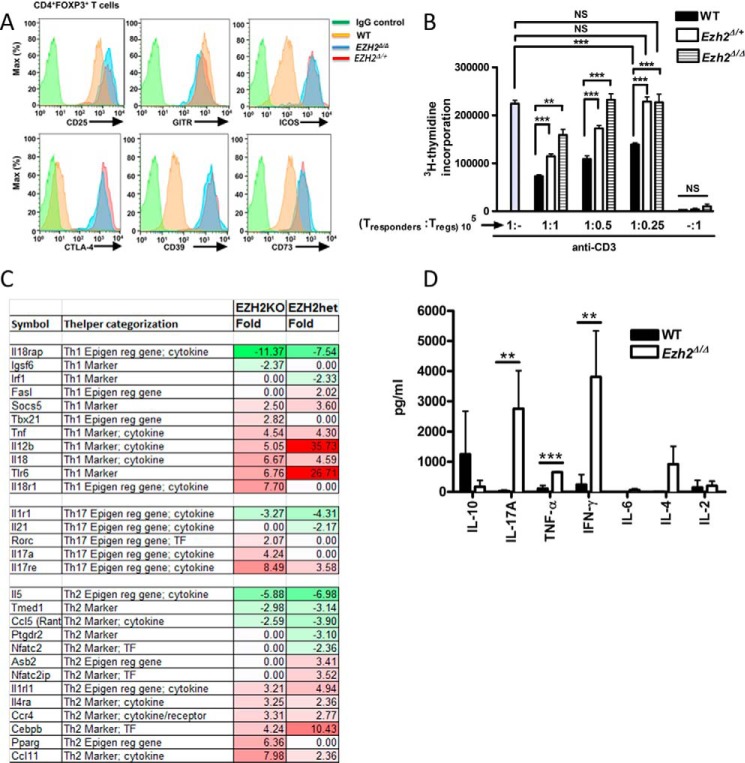
FIGURE 3.
EZH2Δ/ΔFOXP3+ lymphocytes transform to a proinflammatory phenotype. A, the expression of cell surface markers in Treg cells (CD4+FOXP3+) measured by flow cytometry. Data are representative of three independent experiments (n = 3 mice/experimental group). B, suppression assay measuring the degree of Treg-mediated suppression of CD4+ T responder cells (105) in response to anti-CD3 ± CD4+CD25+ Treg titrations (105, 0.5 × 10⁵, or 0.25 × 10⁵ cells) from either EZH2Δ/Δ, EZH2Δ/+, or WT mice. The rate of cell proliferation is directly proportional to titrated [3H]thymidine uptake but inversely proportional to Treg-suppressive capability. The result demonstrated represents the mean (S.E.) of four independent experiments (n = 4 biological replicates). Additionally, each independent experiment was performed in triplicate. Statistical significance was performed via non-parametric unpaired t test (Mann-Whitney t test). **, p < 0.01; ***, p < 0.001; NS, not significant. C, gene-targeted microarray demonstrating broad deregulation of inflammatory genes. Color shading corresponds to -fold change (Fold) in mutant sample (EZH2KO or heterozygous, EZH2het) compared with WT samples. Note the general up-regulation (red shading) of gene sets associated with Th1/Th17 T cell phenotypes. D, cytokine concentrations from supernatants of stimulated FOXP3+ cells as measured by multiplex cytokine analysis. Data are mean (S.E.) of four unique biological replicates (n = 4 mice/group). Statistical significance was determined via Mann-Whitney t test for significance. **, p < 0.01; ***, p < 0.001.

