FIGURE 8.
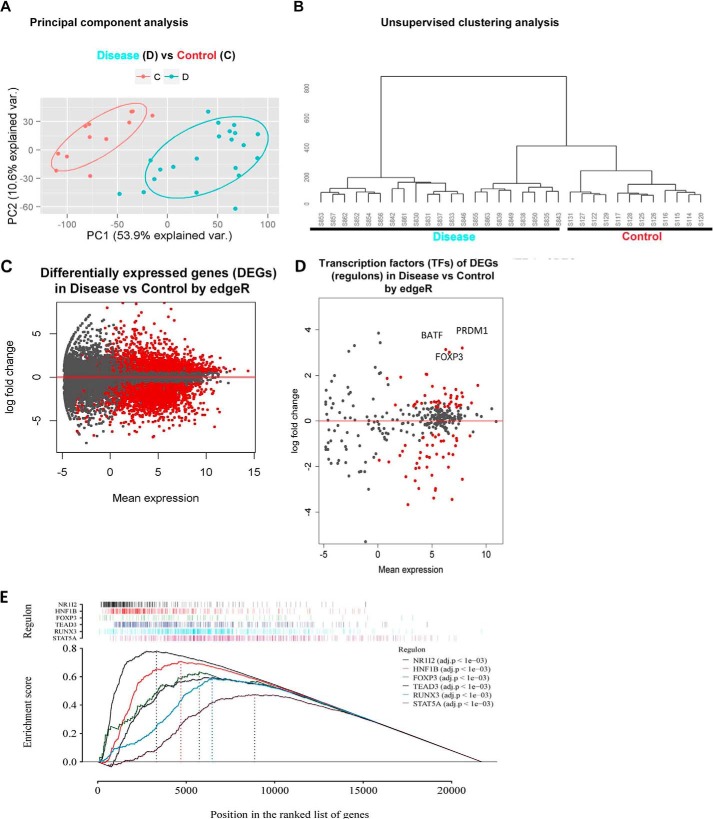
RNA sequencing profiles from terminal Ileal CD4+ lymphocytes from patients with Crohn's disease reveal a significant deregulation of the FOXP3 pathway. A, principal component analysis separates patients (blue dots represent individual patients, D) from controls (orange dots, C). B, unsupervised hierarchical clustering analysis likewise segregates patients (left) from control subjects (right). C, differential expression analysis between patients and CTRL samples shows 5328 confident DEGs (red dots represent significant differential expression), of which 2512 are up-regulated and 2816 down-regulated in CD samples compared with CTRL. D, differential expression analysis of established TFs demonstrating significant differential expression of 83 TFs (red dots). FOXP3, basic zipper transcription factor (BATF), and PRDM1 represent the top three up-regulated TFs. E, GSEA demonstrating the enrichment scores of six significantly enriched regulon networks.

