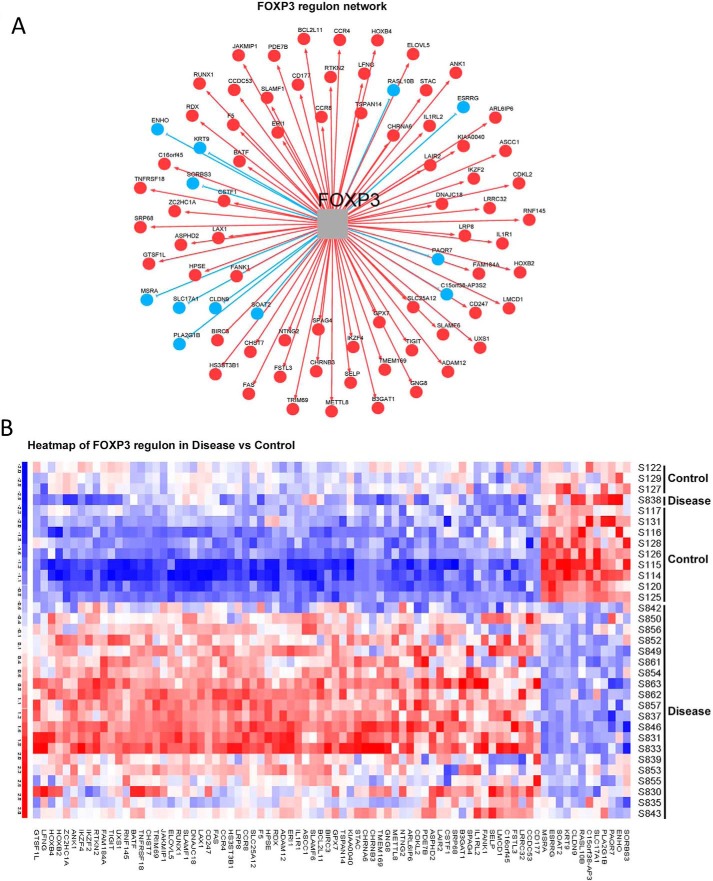
FIGURE 9.
Deregulation of the FOXP3 regulon. A, identification of the 80 specific gene members of the FOXP3 regulon, with red circles indicating up-regulation (68 genes) and blue circles down-regulation (12 genes). B, heatmap representing differential expression of the 80 FOXP3 regulon members between patients (Disease) compared with control subjects.

