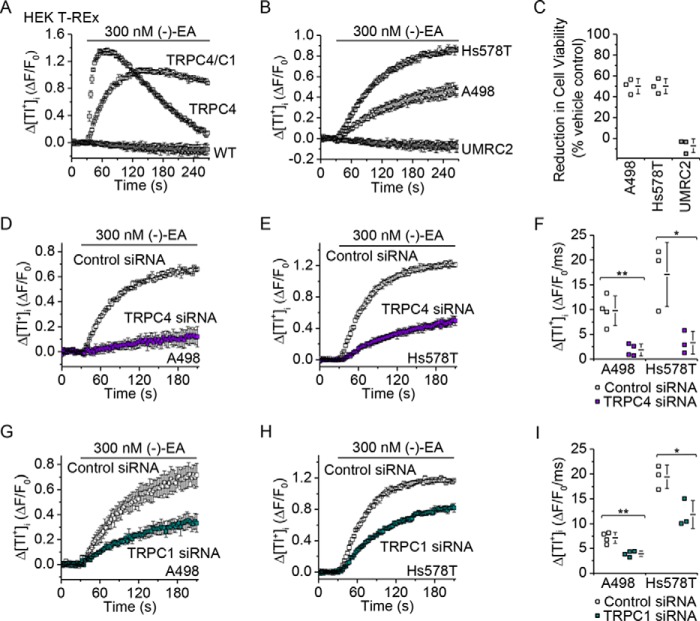
FIGURE 6.
TRPC1 and TRPC4 make similar contributions to (−)-EA-evoked Tl+ entry. A, measurement of Tl+ entry through TRPC channels using FluxOR. An example of 96-well plate FluxOR measurements of the change (Δ) in the intracellular Tl+ concentration upon application of extracellular Tl+ and 300 nm (−)-EA to HEK T-REx cells expressing TRPC4 or TRPC4-TRPC1 concatamer (TRPC4/C1) (n = 3). The FluxOR measurements are displayed as the fluorescence intensity (F) relative to the initial fluorescence intensity (F0). B, FluxOR measurements as for A for the cancer cell lines A498, Hs578T, and UMRC2 (n = 3). C, reductions in cell viabilities caused by 6-h exposures to 300 nm (−)-EA relative to vehicle control as determined by WST-1 assay (N = 3). Note the correlation between reduction in cell viability in C and the data in B. D, E, G, and H, examples of 96-well plate FluxOR measurements upon application of extracellular Tl+ and 300 nm (−)-EA in A498 (D and G) and Hs578T (E and H) cells (n = 3). Experiments were paired comparisons of cells transfected with control scrambled siRNA or TRPC4 siRNA (D and E) or TRPC1 siRNA (G and H) (n = 3). F and I, data for experiments of the type shown in D, E, G, and H in which the rate of change of F was measured between 5 and 35 s after (−)-EA application (A498, N = 4; Hs578T, N = 3) (*, p < 0.05; **, p < 0.01; two-sample t test). Each data point in C, F, and I represents a value from an independent experiment with mean values indicated alongside. Error bars represent S.D.

