
FIGURE 2.
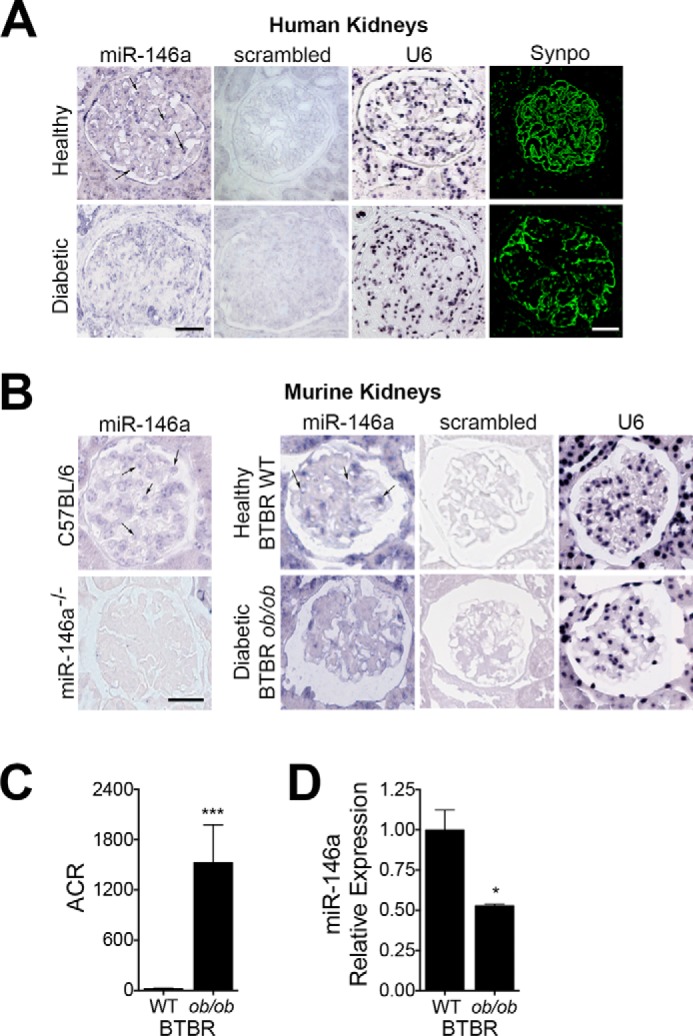
miR-146a levels are reduced in the diabetic human and mouse kidney glomeruli. A and B, representative ISH images of human (A) and mouse (B) kidney sections to detect the expression pattern of miR-146a (indicated with an arrow). Each kidney section was stained with the indicated probe (against miR-146a, a scrambled control or against U6 RNA). Confocal images of immunofluorescently labeled glomeruli (A), stained with the podocyte marker synaptopodin (Synpo, green), show relative podocyte density in the representative healthy and diabetic human kidney sections. Representative ISH images of kidney sections from C57BL/6 WT and miR-146a−/− animals stained with a specific probe against miR-146a are also shown (B). Scale bar, 50 μm (A and B). C, a bar graph showing urinary ACR in 12-week-old BTBR WT and BTBR ob/ob animals. Data shown are mean ± S.E. (n = 5/group). ***, p < 0.001. D, a bar graph showing relative expression level of miR-146a in kidney sections from 12-week-old BTBR WT and BTBR ob/ob mice, as measured by qRT-PCR. Data shown are mean ± S.E. (n = 3). *, p < 0.05.