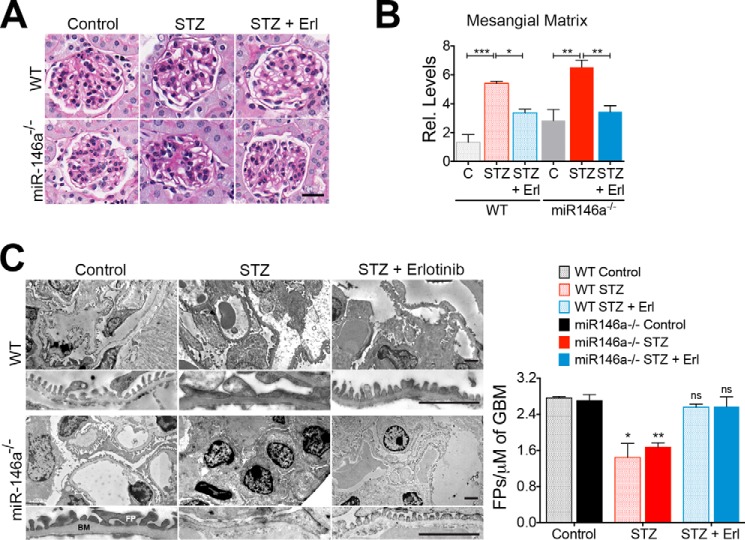
FIGURE 5.
STZ-induced hyperglycemia increases glomerulopathy and foot process effacement in the mouse glomeruli that is suppressed by erlotinib. A, representative images showing PAS-stained kidney tissue samples from WT and miR-146a−/− animals treated with vehicle alone (Control), STZ and vehicle (STZ), or STZ and erlotinib (STZ + Erl) and analyzed 16 weeks post-STZ showing increased mesangial sclerosis in STZ-treated animals that is reduced with erlotinib treatment. Scale bar, 50 μm. B, graphs showing quantification of mesangial matrix expansion from the PAS-stained sections in A. Data shown are normalized to the level of staining in control tissue and are mean ± S.E. (n = 3–5/group). *, p < 0.05; **, p < 0.01; ***, p < 0.001. C, erlotinib protects against STZ-induced podocyte foot process (FP) effacement. Representative electron microscopy images of WT (top panels) and miR-146a−/− (bottom panels) mouse glomeruli treated with vehicle alone (Control), with STZ and vehicle (STZ), or with STZ and erlotinib (STZ + Erl). Scale bar, 2 μm. FP, foot processes; BM, basement membrane. A higher magnification view is presented below every image. Scale bar, 500 nm. A graph on the right shows quantification of the number of FPs per unit glomerular length in each of the samples. Data shown are mean ± S.E. (n = 3/group) and significant difference comparison was performed as compared with the respective controls. *, p < 0.05; **, p < 0.01; ns, not significant.

