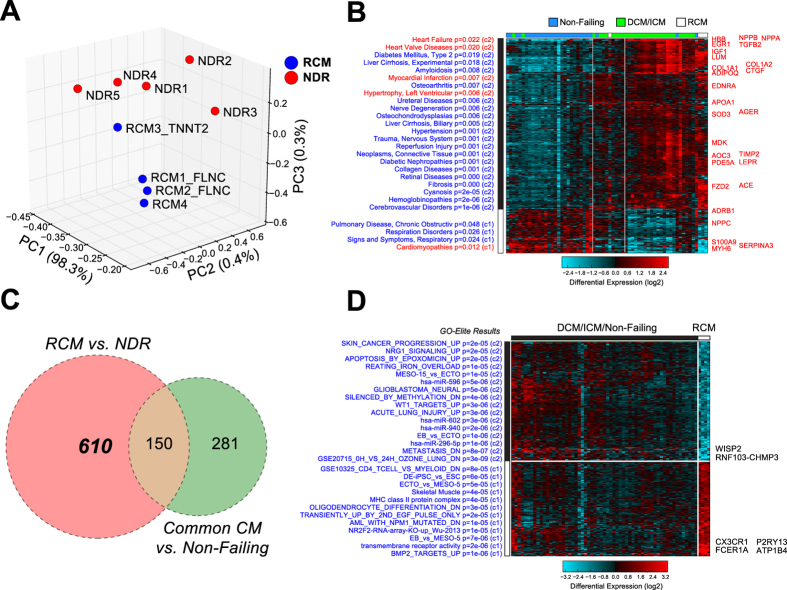
Figure 1. Differential Gene Expression in Pediatric Restrictive Cardiomyopathy.
(A) Principal component (PC) analysis using Single Value Decomposition and z-score expression normalization of RCM samples (blue) and control samples (red). The different visualized axes represent the separation of samples according to each the respective top 3 PCs. The percentage of associated variance described by each PC is shown. (B) Heatmap depicting common differential expression of genes in cardiomyopathy (RCM and ICM/DCM datasets (GSE48166 and GSE55296)) verses non-failing hearts, following moderated FDR adjusted t-test p < 0.05, and a fold change > 1.5. RCM samples are highlighted with white above the cardiomyopathy cluster. Pathway enrichment analysis was performed for each gene cluster using the disease ontology analysis, with cardiac ontology terms and corresponding genes highlighted in red. (C) Venn diagram identifying RCM specific genes. RCM versus NDR controls (pink) identifies the RCM regulated genes. A Common Cardiomyopathy comparison (cardiomyopathy versus non-failing (green)) identifies cardiomyopathy specific genes. (D) Heatmap depicting 359 RCM specific genes, identified by filtering the 610 RCM specific genes to exclude genes identified by the comparison of RCM to the union of all non-RCM samples (moderated FDR adjusted t-test p < 0.05). Pathway enrichment analysis was performed for each gene cluster using the disease ontology analysis, with the most significantly up- and down-regulated genes listed to the right of the heatmap.

