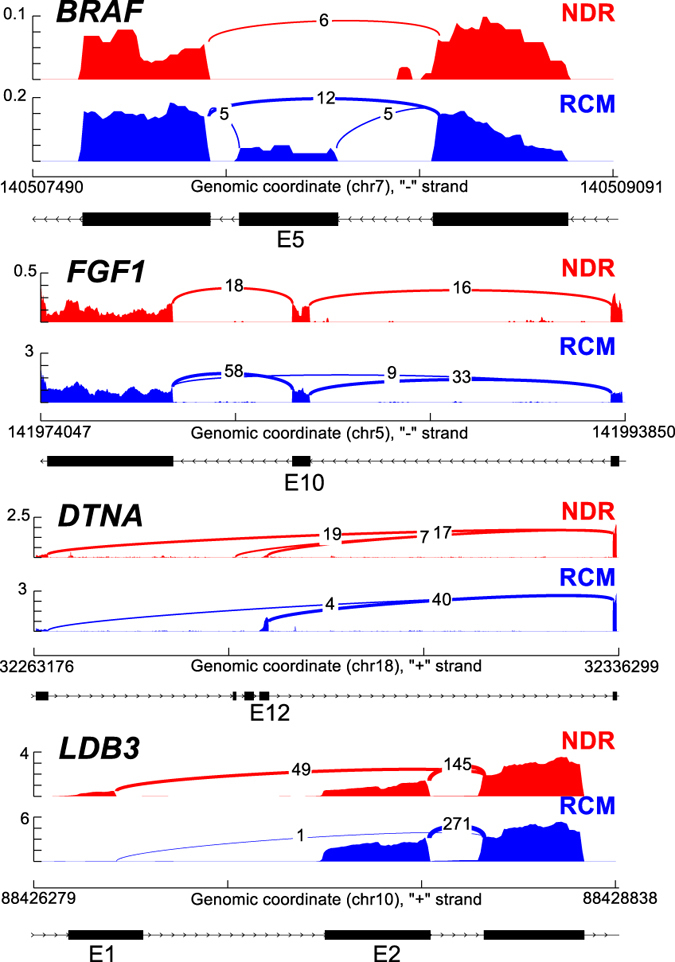
Figure 3. Sashimi Plots of alternative exon and promotor usage.

Sashimi plots of alternative splicing of BRAF and FGF1 depicting exon inclusion (exon 5, E5, and exon 10, E10, respectively), and DTNA and LBD3 depicting alternative promotor usage.

Sashimi plots of alternative splicing of BRAF and FGF1 depicting exon inclusion (exon 5, E5, and exon 10, E10, respectively), and DTNA and LBD3 depicting alternative promotor usage.