
Figure 1.
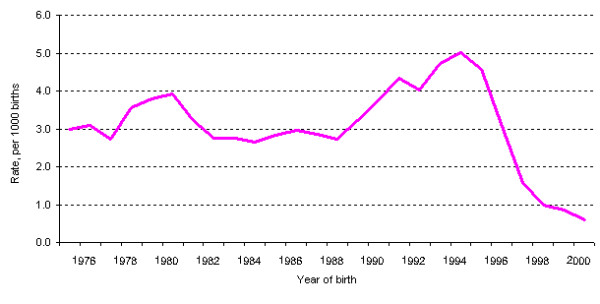
Rates of NTDs in Newfoundland and Labrador, 1976 to 2001 (3-year moving average rates) *The rate for 1976 is a 2-yr average based on data for 1976 and 1977 and the rate for 2001 is a 2-yr average based on data for 2000 and 2001.
Official websites use .gov
A
.gov website belongs to an official
government organization in the United States.
Secure .gov websites use HTTPS
A lock (
) or https:// means you've safely
connected to the .gov website. Share sensitive
information only on official, secure websites.
Rates of NTDs in Newfoundland and Labrador, 1976 to 2001 (3-year moving average rates) *The rate for 1976 is a 2-yr average based on data for 1976 and 1977 and the rate for 2001 is a 2-yr average based on data for 2000 and 2001.