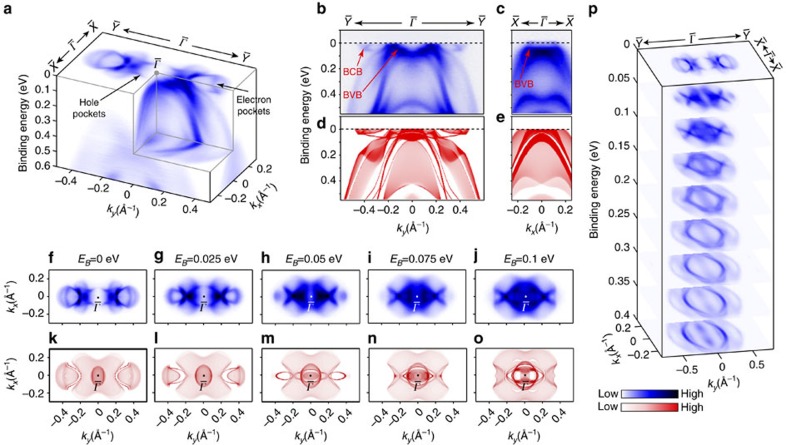
Figure 2. General electronic structure of Td-MoTe2.
(a) The 3D intensity plot of the photoemission spectra around  , with the electron and hole pockets indicated. (b,c) High symmetry cut along the
  and
and  directions, respectively. BCB, bulk conduction band; BVB, bulk valance band. (d,e) The corresponding calculations along the
  and
and  directions, respectively. (f–j) Photoemission spectral intensity map showing the constant energy contours of bands at EB=0, 0.025, 0.05, 0.075 and 0.1 eV, respectively. (k–o) Corresponding calculated constant energy contours at the same binding energies as in experiments above. (p) Stacking plots of constant-energy contours in broader binding energy range show the band structure evolution.

