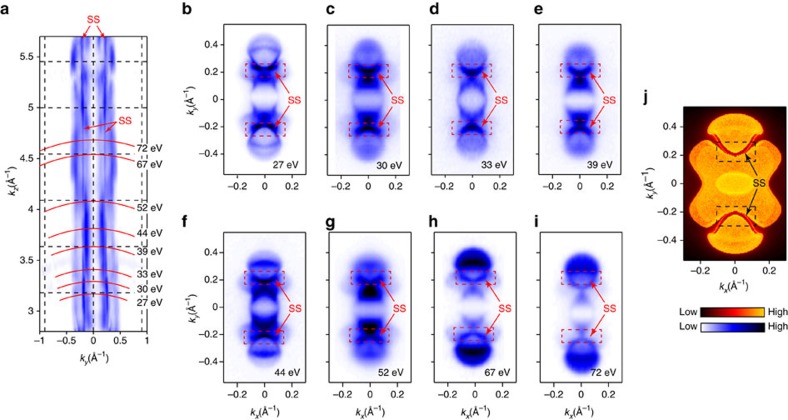
Figure 3. Bulk and surface electronic states of MoTe2 probed by photon energy-dependent ARPES measurements.
(a) The photoemission spectral intensity map in ky–kz plane, where the red arrows indicate the surface states (marked as SS) that show no dispersion along the kz direction. Red curves indicate the kz locations of different photon energies. (b–i) Fermi surfaces measured under different photon energies as indicated in a. Red dashed rectangles and arrows highlight the position of the surface states that do not change shape with the photon energies. (j) Calculated Fermi surface with black dashed rectangles highlighting the same area as in b–i indicating clear surface states inside.

