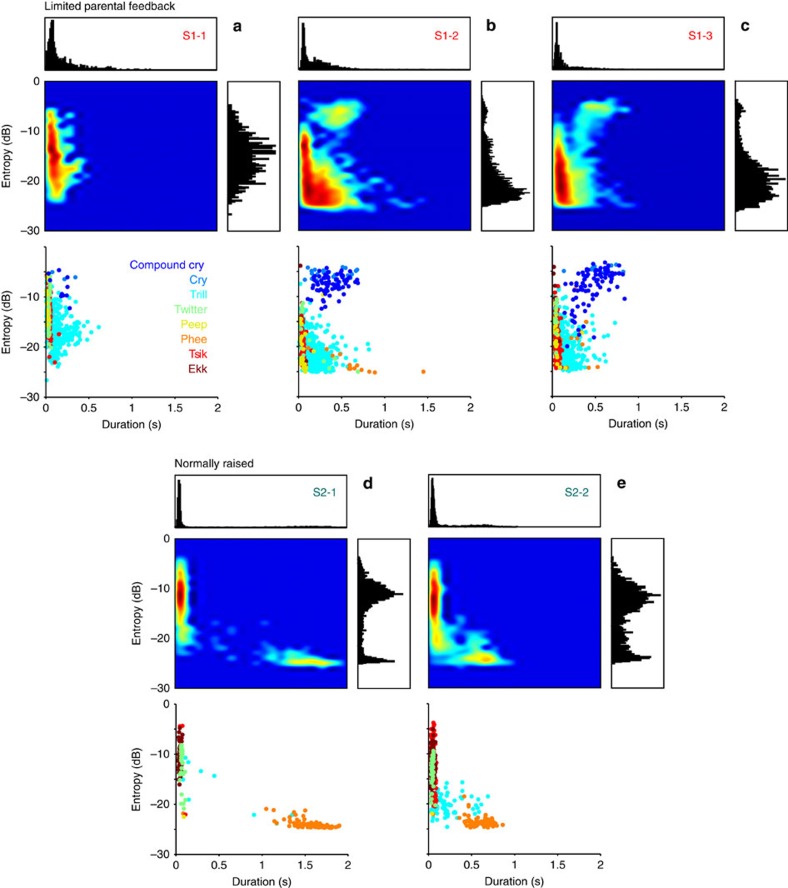
Figure 3. Differences in call entropy and duration between S1 and S2 monkeys.
Heat maps depict logarithmic probability maps of call entropy and duration for S1 (a–c) and S2 siblings (d,e; middle left panels). Warmer colours indicate higher probabilities. Histograms show absolute distribution of call entropy (middle right panels) and duration (upper panels). Raster plots show correspondence between clusters and call types for a single recording session each (lower panels).

