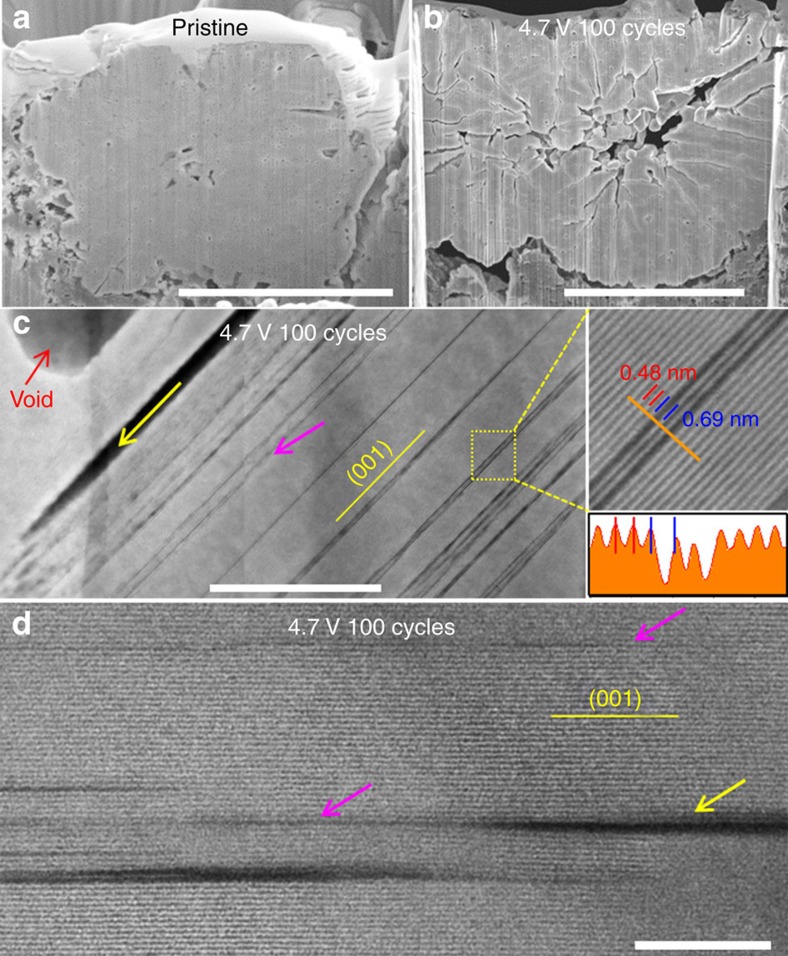
Figure 2. Intergranular and intragranular cracks.
Cross-sectional SEM images of secondary particles from (a) the pristine material and (b) the cycled one (100 cycles at the high cutoff voltage of 4.7 V). (c) and (d) are HAADF images from cycled LiNi1/3Mn1/3Co1/3O2 cathode particles, showing intragranular cracks along (001) plane. The yellow arrows indicate real cracks and the pink arrows indicate incubation cracks. Scale bars, 5 μm (a,b); 50 nm (c); and 10 nm (d).

