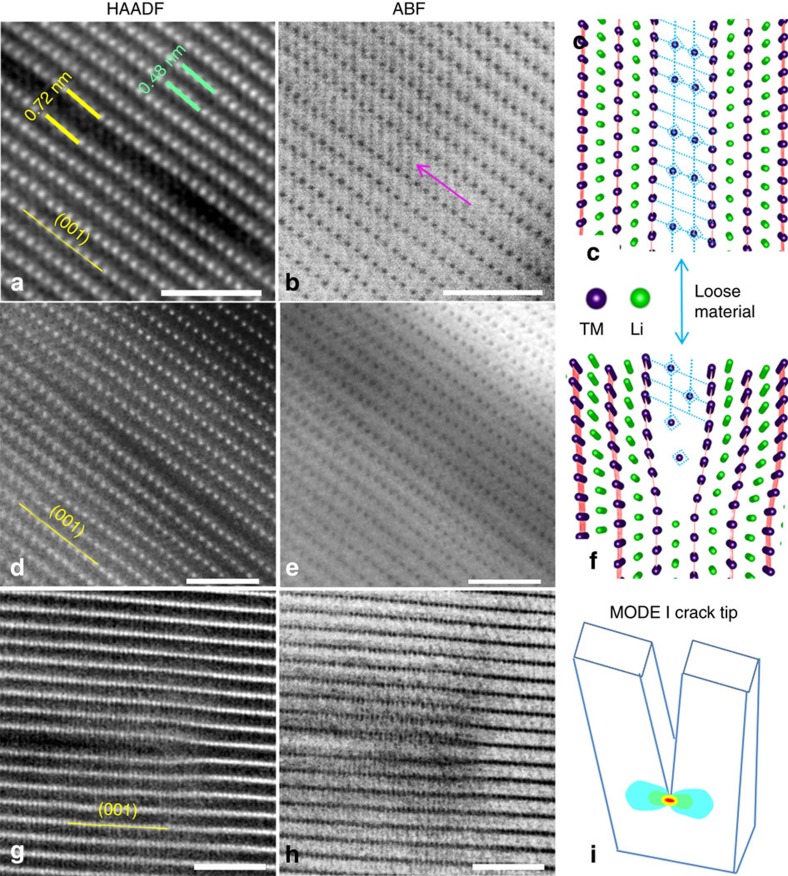
Figure 3. Lattice images of premature cracks.
Each pair of HAADF and ABF images are taken simultaneously. (a,b) [010] axis. (c) The corresponding lattice model. (d,e) A crack tip; (f) The corresponding model. (g,h) [1–10] axis. (i) Strain map at Mode I crack tip, which matches the strain contrast in h. Scale bars, 2 nm.

