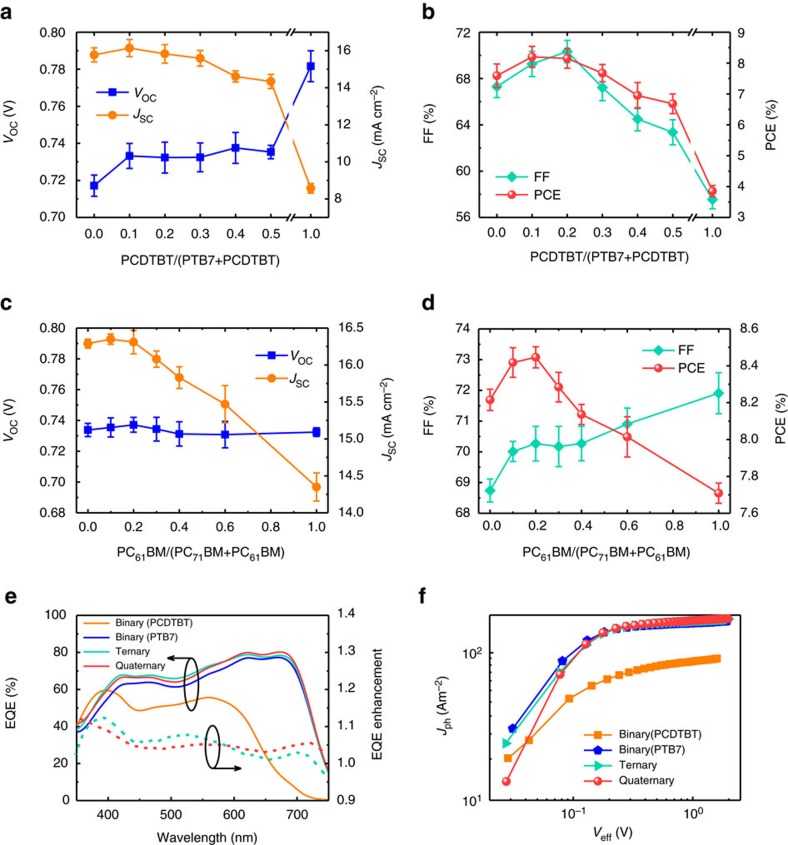
Figure 2. Optimization of compositions of the donors and acceptors in the q-OPV.
Photovoltaic parameters as a function of PCDTBT concentration (x, 0≤x≤1) in PTB7:PCDTBT:PC71BM (1−x:x:1.5) blends (a,b) and PC61BM concentration (y, 0≤y≤1.5) in PTB7:PCDTBT:PC71BM:PC61BM (0.9:0.1:1.5−y: y) blends (c,d). The average and s.d. values in figures a–d were calculated using data from more than 16 cells. (e) EQE spectra and (f) Jph–Veff characteristics of the b-, t- and q-OPVs. The EQE enhancement indicates the ratio of ternary (dotted turquoise line) or quaternary (dotted red line) devices to the PTB7-based binary device.

