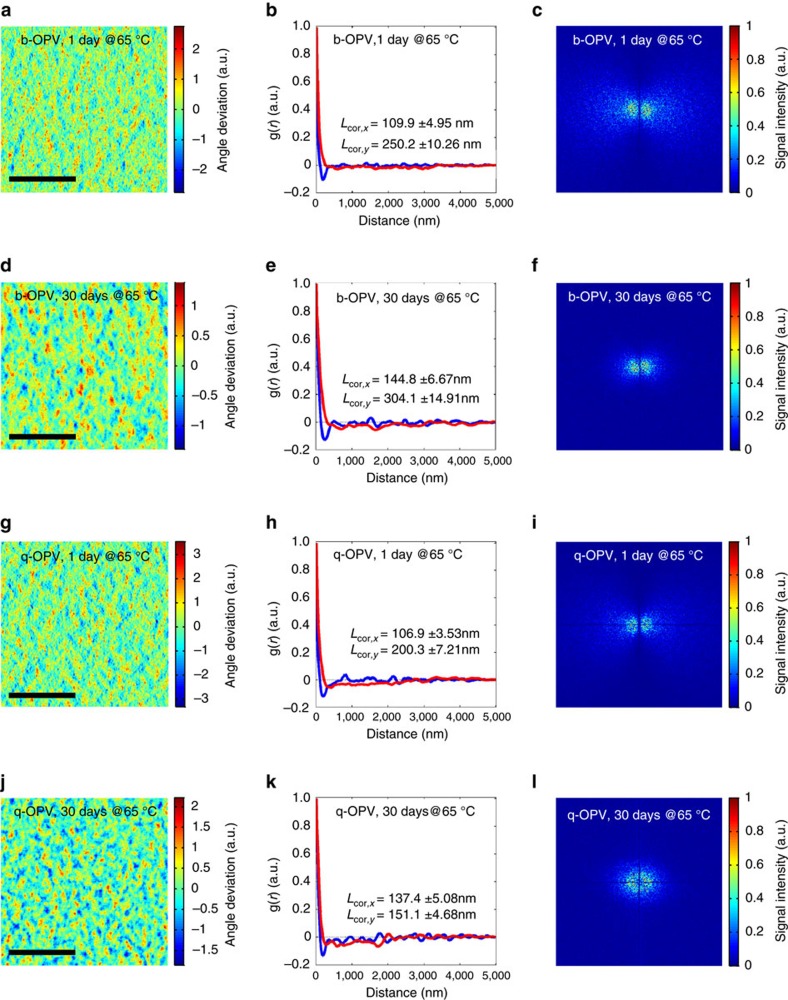
Figure 5. Long-term morphological stability analysis under thermal treatment.
A set of 2D AFM phase images, pair-correlation functions (g(r)), and 2D FFT profiles for the b- and q-OPVs with varying annealing durations at 65 °C: (a–c) b-OPV for 1 day, (d–f) b-OPV for 30 days, (g–i) q-OPV for 1 day and (j–l) q-OPV for 30 days. For the AFM data, colour bars denote the normalized orientational angle deviation and the scan area was 5 × 5 μm2 (scale bars, 2 μm). The error ranges corresponding to the s.d. in b,e,h,k were obtained from AFM analysis of five samples.

