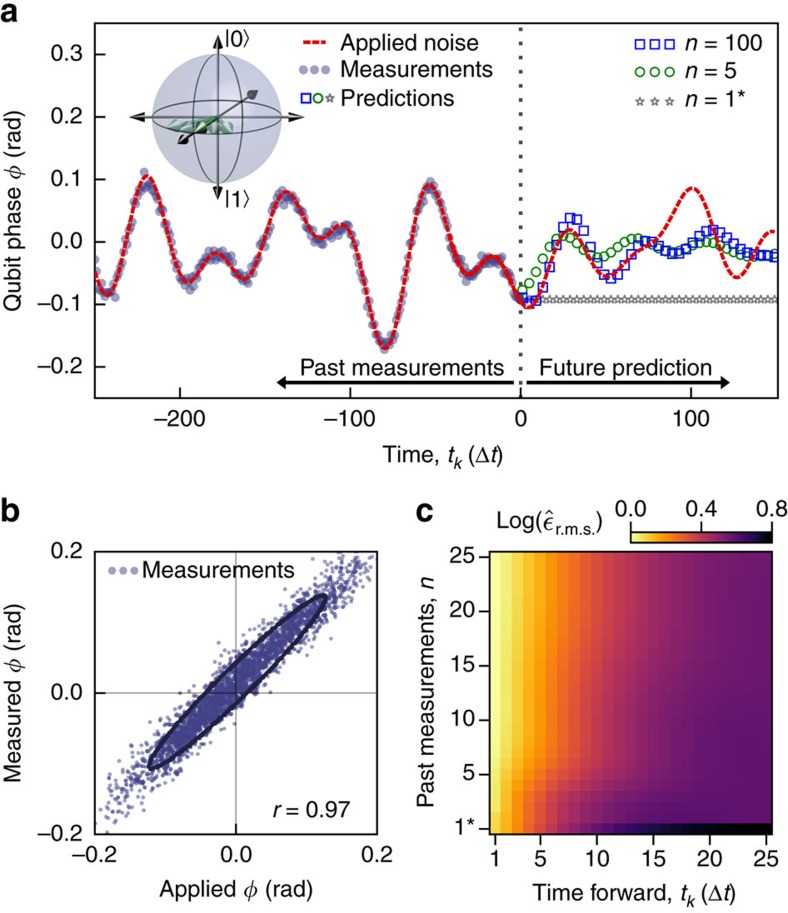
Figure 1. Prediction of the future evolution of a qubit subject to stochastic dephasing.
(a) The average, random phase evolution of the qubit during each measurement under the influence of an engineered noise trace, φA, is probed via Ramsey spectroscopy and a projective measurement performed before the qubit state is reinitialised and the process repeated (Supplementary Methods). Time is represented in discrete increments of Δt, approximately corresponding to the measurement time. Values of tk≤0 refer to past measurements used to make predictions and tk>0 refer to future predictions. Noise possesses a quasi-white power spectral density up to frequency cut-off ωc, which we sample at ωs=40ωc. Future qubit evolution is calculated offline based on these measurements. Data labelled ‘n=1*' correspond to traditional feedback (no prediction). (inset) Bloch sphere representation of randomization of qubit phase. (b) Correlation between φM(tk) and φA(tk) represented as a scatter plot for all measurements in this data set. Ellipses are guides to the eye calculated to have major and minor axis determined by the eigenvectors of the data's covariance matrix. The Pearson product-moment correlation coefficient, r, is calculated to quantify the quality of the measurements—here 97%. (c) Normalized r.m.s. errors  between φA(tk) and φP(tk) as a function of past measurements and discrete steps forward in time, averaged over all elements of the data set. Data are normalized to the lowest overall value in the field and are presented using a logarithmic scale to highlight differences over a broad dynamic range. The first row corresponds to traditional feedback.

