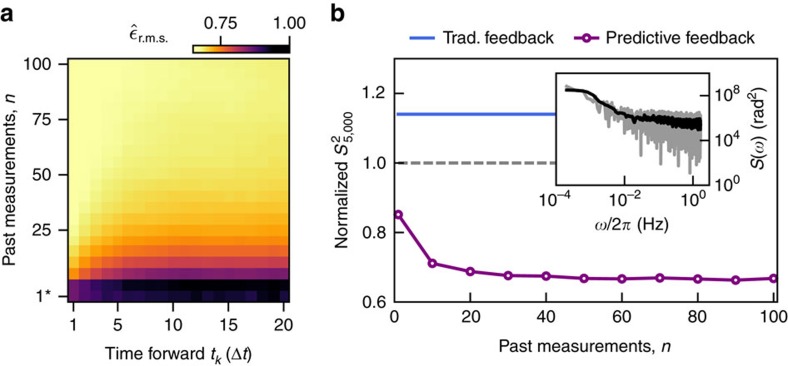
Figure 4. Application of predictive qubit state estimation to intrinsic system noise.
(a) r.m.s. errors between predictions, φP and actual values φ(A) for various numbers of past measurements and discrete steps forward in time, averaged over the whole set of validation data. The r.m.s. values are normalized to the r.m.s.d. of the uncorrected data from zero. The bottom row (1*) corresponds to traditional feedback. (b) Sample variance of the corrected measurements averaged over 5,000 cycles, as a function of past measurements used for prediction, normalized to the sample variance of the uncorrected system. The expected sample variance obtained by performing traditional feedback is added for comparison. Data are split into two subsets, where the first 70% serve for training purposes and the remaining 30% are used for validation. (Inset) Power spectrum of a series of projective measurements on the free-running qubit–LO system. The data is overlaid with a smoothed version to visualize the general trend. The maximum frequency in the spectrum corresponds to our sampling frequency and is about 1.7 Hz.

