
Figure 4.
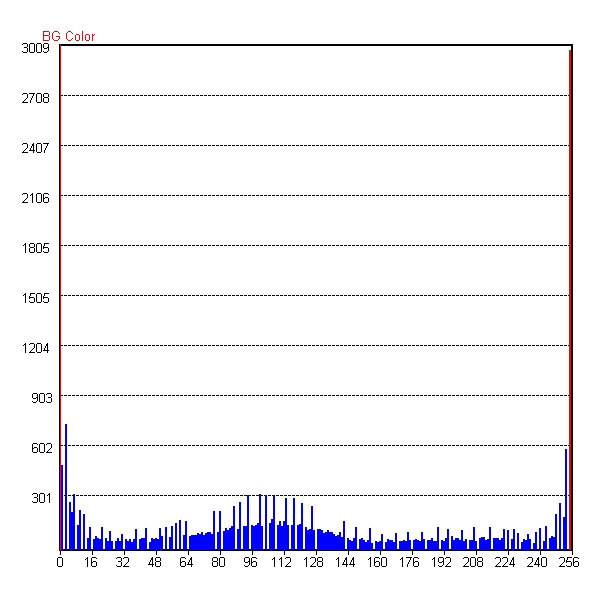
The Grayscale Histogram of ROI. Horizontal axis denotes a grayscale (G), and vertical axis a number of voxels. G = 0 is the background color of black; G = 255 the color of white. From the grayscale distribution corresponding to the tissues in Figure 3, we can define the grayscale range for fat, parenchyma, and tumor tissues.